
Volume 18, Number 3
Tekeisha Zimmerman and Kim Nimon
University of North Texas, University of Texas at Tyler
The Online Student Connectedness Survey (OSCS) was introduced to the academic community in 2012 as an instrument designed to measure feelings of connectedness between students participating in online degree and certification programs. The purpose of this study was to examine data from the instrument for initial evidence of validity and reliability and to establish a nomological network between the OSCS, the Classroom Connectedness Survey (CCS), and the Community of Inquiry Survey (COI), which are similar instruments in the field. Results provided evidence of factor validity and reliability. Additionally, statistically and practically significant correlations were demonstrated between factors contained in the OSCS and established instruments measuring factors related to student connectedness. These results indicate that for the sample used in this study, the OSCS provides data that are valid and reliable for assessing feelings of connection between participants in online courses at institutions of higher learning.
Keywords: distance learning, student connectedness, factor validity, construct validity
The struggling economy and increased competition in the job market have helped intensify enrollment in online classes at higher education institutions (Sheehy, 2012). This growth has led to an upsurge in research into factors that result in student success in online classes, most notably online student connectedness (Garrison & Arbaugh, 2007; Ouzts, 2006). Online student connectedness refers to human interactions in computer-mediated learning environments that allow individuals to participate comfortably in group communication while simultaneously forming social relationships within the group (Galambos, Abelson, & Black, 1986). The ability to understand how students interact and succeed in online courses is critical because online learning is expected to be a vital part of long-term strategies for many higher education institutions (Sheehy, 2012). The need to study factors related to online connectedness has been addressed by several authors (Rovai, 2002a; Slagter van Tyron & Bishop, 2006, 2009; Shin, 2003; Tu & McIsaac, 2002). However, a review of the contemporary literature yielded three instruments designed to measure the concept of online student connectedness (Bolliger & Inan, 2012). These instruments are: the Classroom Community Scale (CCS; Rovai, 2002a), the Community of Inquiry Scale (COI; Arbaugh et al., 2008), and the Online Student Connectedness Survey (OSCS; Bolliger & Inan, 2012).
Rovai (2002a) developed the CCS to measure students' sense of community in a learning environment. Subscales were shown to measure social community and learning community, but a test of the psychometric properties revealed that the CCS might be best suited for graduate students (Barnard-Brak & Shiu, 2010). While the CCS measures the relationship between students as it relates to sense of community and perceived learning, it ignores the importance of relationships that students build with the course facilitator and their need for comfort with technology. Evidence suggests that students' feelings toward the facilitator and their level of comfort with technology are critical factors in developing feelings of social connectedness in online educational settings (Bolliger, 2004; Bolliger & Inan, 2012; Garrison & Arbaugh, 2007).
Arbaugh et al. (2008) developed the COI to measure the degree to which social presence, cognitive presence, and teacher presence constitute a sense of community. Factor analysis for the COI supported the idea of teaching presence as a construct, but it also suggested inconsistencies about whether teaching presence measured one or two factors (Bangert, 2009). While the feeling of community is one facet measured by the COI through its social presence factor, the instrument's purpose is to examine how features of written language promote critical thinking in computer-mediated learning environments (Arbaugh & Benbunan-Fich, 2007). Therefore, it can be argued that the COI is better suited to measure perceived learning than feelings of online student connectedness.
In 2012, Bolliger and Inan introduced the OSCS, which purports to measure feelings of connectedness between students in online degree and certification programs. The OSCS examines four factors attributed to the development of online student connectedness: comfort, community, facilitation, and interaction and collaboration. Based on this review of instruments designed to measure feelings of connectedness, the OSCS may be the first all-inclusive survey designed specifically for participants in online educational settings.
The purpose of this study was twofold and was conducted in two parts. Study 1 examined factor validity for OSCS data, confirmed the factor structure of the refined set of items, and tested and reported reliability of the scale scores. Following Study 1, Study 2 sought to confirm the structure from Study 1 and test the nomological network for the instrument using the proposed theoretical model. Confirming the structure on an independent sample demonstrates the stability of the model across samples and is common in psychometric studies (Petrie, Tripp, & Harvey, 2002). Because the OSCS is a newly developed instrument, evidence of factorial validity is limited, and a nomological network has not been established. Establishing a set of constructs related to online student connectedness that are generalizable to a variety of audiences would facilitate discussion in both the academic and practitioner communities and allow for studies of this phenomenon across disciplines.
Study 1 was guided by the following hypotheses to examine factor validity for the OSCs:
H1a: Pattern coefficient values for data from each of the four subscales will be >.70 (Hair, Black, Babin, & Anderson, 2010).
H1b: Reliability coefficient values for data between the full instrument and data from each subscale will be.80 or higher (Nunnally, 1978; Henson, 2001).
H1c: Factor structure scores for the OSCS will yield good fit indices: CMIN/ df >.30, Tucker-Lewis index (TLI) >.95, comparative fit index (CFI) >.95, root mean square error of approximation (RMSEA) <.70, standardized root mean square residual (SRMR) <.08 (Byrne, 2010; Hooper, Coughlan, & Mullen, 2008; Kline, 2005).
Study 2 sought to replicate the confirmed factor structure from Study 1 and provide evidence of a nomological structure for the OSCS. As it relates to the OSCS, theory supports the following hypotheses:
H2: Data from the OSCS will be positively correlated with data from the CCS.
H2a: Data for comfort from the OSCS will demonstrate a strong correlation with data for connectedness and data for learning from the CCS.
H2b: Data for community from the OSCS will demonstrate a strong correlation with data for connectedness and data for learning from the CCS.
H2c: Data for facilitation from the OSCS will demonstrate a strong correlation with data for learning and a moderate correlation with data for connectedness from the CCS.
H2d: Data for interaction and collaboration from the OSCS will demonstrate a strong correlation with data for connectedness and data from learning from the CCS.
H3: Data from the OSCS will be both positively and negatively correlated with data from the COI.
H3a: Data for comfort from the OSCS will demonstrate a strong positive correlation with data from social presence and data for teaching presence from the COI.
H3b: Data for community from the OSCS will demonstrate a strong positive correlation with data for social presence and a moderate positive correlation with data from teaching presence from the COI.
H3c: Data for facilitation from the OSCS will demonstrate a strong positive correlation with data from teaching presence and a moderate positive correlation with data for social presence from the COI.
H3d: Data for interaction and collaboration from the OSCS will demonstrate a strong positive correlation with data for teaching presence and a moderate positive correlation with data for social presence from the COI.
H3e: Data for comfort and facilitation from the OSCS will demonstrate a strong positive correlation with data for cognitive presence from the COI.
H3f: Data for community and interaction and collaboration from the OSCS will demonstrate a weak positive correlation with data for cognitive presence from the COI.
To identify influential theories and empirical studies related to online student connectedness, a search using the key terms student connectedness, online course, and community was performed in Google Scholar, EBSCO Host, and ABI/Inform. This search yielded 41 articles. A review of these articles resulted in the discovery of the five theories noted in this study as being related to factors influencing online student connectedness. These theories have influenced two prominent, widely used, empirically tested instruments that purport to measure student connectedness in learning environments: the Classroom Community Scale (CCS) and the Community of Inquiry (COI) Scale.
The CCS is composed of two factors: learning and connectedness. Both factors have been cited as promoting student connectedness (Rovai, 2002a). Randolph and Crawford (2013) related these subscales to Bolliger and Inan's (2012) factors of interaction and collaboration, facilitation, and community, which suggests a strong relationship between the CCS and the OSCS. The first scale of the CCS, learning, is defined as "the feeling that knowledge and meaning are actively constructed within the community, that the community enhances the acquisition of knowledge and understanding, and that the learning needs of its members are being satisfied" (Rovai, 2002b, p. 201). Within the framework of the CCS, learning and sense of community are strongly linked. Sense of community is defined as "a feeling that members have of belonging, a feeling that members matter to one another and to the group, and a shared faith that members' needs will be met through their commitment to be together" (McMillan & Chavis, 1986, p. 9). When participants feel a sense of community, trust begins to develop, participants are more open to asking questions of one another to help support their learning, and meaningful relationships begin to form (Dawson, 2006).
The second scale of the CCS, connectedness, is defined as "the feeling of belonging and acceptance and the creation of bonding relationships" (Rovai, 2002b, p. 201). This feeling manifests in verbal and nonverbal behaviors that help to personalize interactions and is viewed as a positive factor in affecting learning outcomes. The OSCS addresses these feelings within the factor of interaction and collaboration. The factor of interaction and collaboration is described as a two-way communication process that requires students to work collaboratively with one another. This type of interaction inspires critical thinking and furthers knowledge (Bolliger & Inan, 2012).
Both learning and connectedness are prominent factors in the theory of e-mmediacy (Slagter van Tyron & Bishop, 2006). E-mmediacy is defined as "the feeling of social connectedness one has with fellow online class participants (classmates, instructor, and teaching assistant) through computer mediated experiences" (Slagter van Tyron & Bishop, 2006, p. 293). E-mmediacy also examines how technology can both enhance and impede social connectedness in online learning settings. The success of the learning environment is dependent on behaviors that reduce the perception of distance. The OSCS refers to the enhancement of technology in online educational settings as comfort and the subsequent relationship building as facilitation. Comfort, facilitation, and e-mmediacy contribute to the development of relationships within the CMC and are strongly tied to social information processing. Social information processing explains how people get to know one another and how they develop and manage relationships in CMC settings without nonverbal cues (Walther, 1992). The theory asserts that the amount of time it takes to observe and decode information from textual cues impacts the feeling of connection among participants in CMC settings and contends that the time it takes to transmit the message and the way the message is interpreted by others that determines if a connection will take place.
The COI measures the dimensions of social presence, cognitive presence, and teaching presence in learning environments (Arbaugh et al., 2008). The first factor of the COI, social presence, is defined in terms of how "real" a person seems during CMC (Short, Williams, & Christie, 1976). Garrison, Anderson, and Archer (2000) related this definition to online learning by defining social presence within an online educational environment as "the ability for learners to project themselves socially and emotionally, thereby representing themselves a ‘real people' in mediated communication" (p. 94). Social presence facilitates more frequent interactions, thereby forming bonded relationships within the environment. This type of bonded relationship has been correlated to community and interaction and collaboration from the OSCS (Akyol, Garrison, & Ozden, 2009; Northrup, 2002; Ryle & Cumming, 2007).
Teaching presence is described as instructional management that leads to building understanding and personal meaning among students (Garrison, Anderson, & Archer, 2000). Instructors are viewed as central figures in establishing a sense of community and teaching presence, although they are often not viewed as central figures in the community of learning by their students. Teaching presence has been linked to facilitation from the OSCS (Bolliger & Inan, 2012; Young, 2006).
Cognitive presence is described as triggering events that elicit critical thinking among learners (Garrison et al., 2000). Examples of events related to cognitive thinking are discussion board interactions, and student reflection-type activities (Ryle & Cumming, 2007). Several studies link teaching presence to cognitive presence through learning outcomes, and it has been suggested that it is the instructor's role to enhance cognitive awareness among students (Bolliger, 2004; Bolliger & Inan, 2012, Arbaugh & Benbunan-Fich, 2007; Garrison et al., 2000; Garrison & Arbaugh, 2007; Slagter van Tyron & Bishop, 2006, 2009). The instructor's actions are also linked to developing a sense of comfort with technology (Slagter van Tyron & Bishop, 2006). Cognitive presence has not been directly correlated with connectedness in the literature; rather it has been tied to the ability to construct and confirm meaning in higher education settings. Figure 1 represents the directional strengths and paths for this hypothesized nomological network.
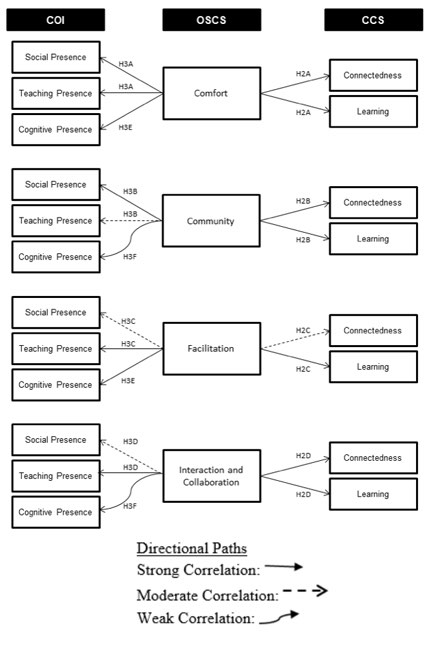
Figure 1. Hypothesized model for OSCS nomological network.
A literature review was conducted to identify theories and instruments related to the construct of online student connectedness. Five theories informed the theoretical model used to test the nomological network for the OSCS. The first is e-mmediacy (Slagter van Tyron & Bishop, 2006) because it focuses on a wide scope of factors that facilitate social connectedness in online settings. Walther's social information processing theory (1992) is the second theoretical viewpoint. Social information processing theory contends that the medium itself is not the reason that connection among participants may be limited. Rather, the time it takes to transmit the message and the way the message is interpreted by others determines if a connection will take place. Social information processing provides a relevant theoretical lens because it offers insight into how people process information in a computer-mediated environment over time. As factors contributing to connection are explored, this theory may add valuable insight about the time it takes to develop relationships in online learning settings, and how the interpretation of the message being shared can enhance or hinder the relationship. Contributing to the foundation of the nomological network are McMillan and Chavis' (1986) sense of community theory; Garrison et al.'s (2000) community of inquiry theory; and Short, Williams, and Christie's (1976) social presence theory. Figure 2 depicts the theoretical model informing the proposed nomological network.
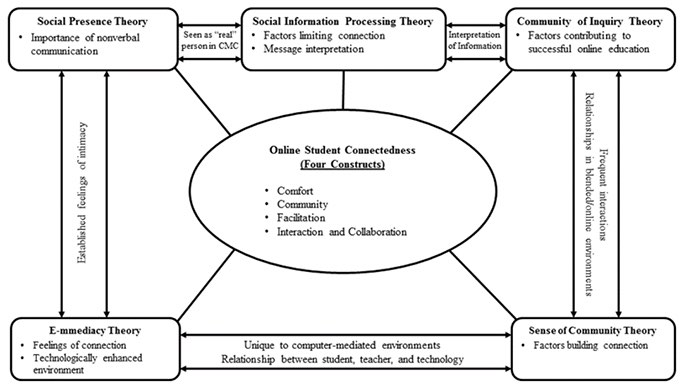
Figure 2. Theoretical model to test OSCS nomological network.
The purpose of Study 1 was to examine factor validity for OSCS data. Study 1 utilized a quantitative, cross-sectional, correlational research design. Survey methodology was used to gather information. The target population for this study included students enrolled in online courses at 4-year, public higher education institutions located in the United States.
Participants for Study 1 were limited to undergraduate and graduate-level students currently enrolled in at least one online course at an institution of higher learning in the United States. Participants were identified through the research firm Qualtrics, which pre-recruits and pools together individuals who are representative of a particular population and have agreed to take part in the survey for incentives (Rao, Kaminska, & McCutcheon, 2010). Qualtrics was provided with the sample size needed, the survey questions, and prescreening questions to ensure that participants met the criteria. Qualtrics emailed the target population a link to the survey. Of the 1,176 surveys sent, 477 usable responses were obtained representing a 40.56% response rate. Of those, 35.2% were male, 88.8% were undergraduates, and 11.2% were at the graduate-level.
The OSCS is a 25-item, self-report scale purported to measure feelings of connectedness for students enrolled in online degree or certification programs (Bolliger & Inan, 2012). The instrument consists of four subscales that measure comfort, community, facilitation, and interaction and collaboration. The OSCS contains statements such as I feel comfortable in the online learning environment provided by my program and I work with others in my online course. Items are rated using a 5-point Likert scale ranging from 1 (strongly disagree) to 5 (strongly agree). Data for reliability from the instrument was reported as α =.98 during initial validation (Bolliger & Inan, 2012). In addition to the OSCS, participants were asked five demographic questions created by the researcher.
Sequential EFA-CFA was conducted to examine factor validity (Durvasula, Netemeyer, Andrews, & Lysonski, 2006; Worthington & Whittaker, 2006). Using the SPSS random selection feature, the original sample (n1=477) was randomly split. EFA was conducted using 1/3 of the responses (n=159), with the remaining 2/3 (n2 =318) saved for CFA analysis. Alpha coefficients were computed for the full-scale and each subscale of the OSCS, and average variance extracted (AVE), composite reliability (CR), and the associated squared interconstruct correlation (SIC) values were calculated to examine convergent and divergent reliability. The study used self-report data, therefore common method bias was also examined prior to attempting CFA. Once data were deemed suitable, CFA was run to confirm the refined set of items. Alpha coefficients, AVE, CR, and SIC were again calculated to test the structure.
For the initial EFA, four factors were extracted based on a priori knowledge of the instrument's structure (Bolliger & Inan, 2012). The four factors accounted for 66.81% of the total variance explained. Five items were deleted because they either did not load on the correct factor, or they had pattern coefficients less than.50 (Ford, MacCallum, & Tait, 1986; Henson & Roberts, 2006), and had substantial loadings on more than one factor (Matsunaga, 2010). The analysis was rerun three additional times, resulting in the deletion of four additional items and leaving the refined set of 16 items. Each remaining item had acceptable pattern coefficients, which provided support for Hypotheses H1a. The final set of items accounted for 77.17% of the total variance extracted. Table 1 shows the pattern and structure matrices for the original scale and the 16 retained items.
Alpha reliability was computed at.906 overall for all retained OSCS items. Reliability scores for items composing each factor were.836,.924,.862, and.923, for factors 1 to 4 respectively. Coefficient alphas of the total scale and subscales demonstrated acceptable reliability (Nunnally, 1978; Tait, Chibnall, & Krause, 1990), which provided support for Hypothesis H1b. Overall, data were considered suitable for further analysis, and CFA was performed.
Table 1
EFA Pattern/Structure Matrix and Reliabilities for Original and Revised OSCS
| Scale | Item | Initial reli- abilities | Initial pattern matrix | Initial structure matrix | Revised reli- abilities | Revised pattern matrix | Revised structure matrix | ||||||||||||
| 1 | 2 | 3 | 4 | 1 | 2 | 3 | 4 | 1 | 2 | 3 | 4 | 1 | 2 | 3 | 4 | ||||
| CFT | .829 | .836 | |||||||||||||||||
| CFT5 | .068 | .095 | -.063 | .628 | .377 | .497 | .426 | .789 | - | - | - | - | - | - | - | - | |||
| CFT1 | .018 | .093 | -.063 | .626 | .347 | .473 | .338 | .687 | - | - | - | - | - | - | - | - | |||
| CFT3 | .438 | -.057 | -.105 | .451 | .795 | .137 | .580 | .368 | - | - | - | - | - | - | - | - | |||
| CFT4 | .822 | .121 | -.107 | .027 | .788 | .256 | .499 | .443 | .663 | .034 | .043 | .095 | .743 | .269 | .528 | .442 | |||
| CFT8 | .734 | -.039 | .120 | -.022 | .758 | .131 | .540 | .377 | .767 | -.032 | .074 | -.019 | .799 | .162 | .561 | .345 | |||
| CFT7 | .696 | -.060 | .084 | .037 | .705 | .143 | .591 | .528 | .892 | -.037 | -.047 | -.013 | .846 | .247 | .522 | .359 | |||
| CFT2 | .437 | -.253 | .213 | .366 | .574 | .267 | .392 | .573 | - | - | - | - | - | - | - | - | |||
| CFT6 | .374 | -.014 | .137 | .134 | .526 | .195 | .447 | .375 | - | - | - | - | - | - | - | - | |||
| COM | .915 | .924 | |||||||||||||||||
| COM11 | -.079 | .806 | -.035 | .123 | .115 | .854 | .290 | .568 | .003 | .912 | -.111 | -.003 | .217 | .831 | .275 | .478 | |||
| COM12 | -.097 | .802 | .099 | .074 | .214 | .841 | .350 | .542 | -.034 | .859 | .048 | -.009 | .072 | .839 | .241 | .487 | |||
| COM14 | .061 | .832 | -.016 | .004 | .160 | .867 | .384 | .576 | -.002 | .829 | .034 | -.002 | .174 | .925 | .356 | .629 | |||
| COM10 | -.113 | .766 | .065 | .074 | .115 | .815 | .326 | .528 | -.071 | .827 | .021 | .005 | .244 | .844 | .418 | .509 | |||
| COM9 | .054 | .698 | -.132 | .166 | .183 | .761 | .260 | .559 | .031 | .747 | -.068 | .050 | .214 | .857 | .329 | .602 | |||
| COM13 | .118 | .755 | .057 | -.045 | .280 | .771 | .405 | .508 | .040 | .694 | .107 | .030 | .228 | .764 | .482 | .520 | |||
| FAC | .816 | .862 | |||||||||||||||||
| FAC17 | -.125 | .031 | .468 | .475 | .361 | .499 | .460 | .654 | - | - | - | - | - | - | - | - | |||
| FAC20 | -.045 | -.040 | .875 | .019 | .536 | .303 | .839 | .416 | -.080 | -.062 | .787 | .178 | .507 | .322 | .737 | .399 | |||
| FAC18 | .220 | .118 | .770 | -.271 | .623 | .292 | .824 | .299 | .005 | -.008 | .918 | -.045 | .587 | .293 | .824 | .303 | |||
| FAC16 | -.061 | -.084 | .632 | .271 | .634 | .305 | .742 | .302 | - | - | - | - | - | - | - | - | |||
| FAC19 | .343 | .179 | .582 | -.269 | .472 | .319 | .697 | .511 | .208 | .091 | .675 | -.116 | .620 | .305 | .792 | .300 | |||
| FAC15 | .049 | -.058 | .518 | .239 | .496 | .302 | .650 | .490 | - | - | - | - | - | - | - | - | |||
| INT | .909 | .923 | |||||||||||||||||
| INT24 | .014 | .149 | -.052 | .851 | .417 | .659 | .446 | .923 | .004 | .100 | -.049 | .905 | .417 | .691 | .336 | .955 | |||
| INT23 | .052 | .068 | -.062 | .839 | .427 | .575 | .424 | .875 | .018 | .021 | -.023 | .876 | .416 | .606 | .332 | .890 | |||
| INT25 | -.032 | .001 | .053 | .777 | .443 | .612 | .466 | .789 | -.054 | -.052 | .087 | .824 | .375 | .521 | .348 | .797 | |||
| INT22 | .109 | .217 | .006 | .600 | .420 | .484 | .639 | .672 | .097 | .155 | .007 | .670 | .450 | .631 | .383 | .823 | |||
| INT21 | -.012 | .130 | .167 | .494 | .296 | .461 | .303 | .661 | - | - | - | - | - | - | - | - | |||
Note. CFT = comfort; COM = community; FAC = facilitation; INT = interaction and collaboration
Confirmatory factor analysis was conducted to analyze model fit on the refined version of the OSCS. Factor loadings and five common model-fit measures were used to assess the model's overall goodness of fit. Factor structure scores met acceptable fit indices (Byrne, 2010; Hooper et al., 2008; Kline, 2005), and the range of composite reliability (CR: .62-.86) and average variance extracted (AVE:.55-.70) provided evidence of adequate convergent validity. Shared variances between factors were lower than the associated squared interconstruct correlation (SIC) of individual factors, thus providing evidence of discriminant validity. Reliability coefficient values were calculated at .907 for the full scale and .829, .915, .816, and .909 for subscales 1, 2, 3, and 4 respectively. This supported Hypotheses H1c Model fit indices are shown in Table 2.
Table 2
CFA Fit Indices for Measurement Model
| Goodness of fit measure | Recommended value | Default model |
| CMIN/df | > 3.0 | 2.414 |
| CFI | ≥ .95 | .955 |
| RMSEA* | ≤ .08 | .067 |
| TLI | ≥ .95 | .945 |
| SRMR | ≥ .08 | .048 |
Note. CMIN/df = chi-squared divided by degrees of freedom; CFI = comparative fit index; RMSEA = root mean square error of approximation; TLI = Tucker-Lewis index; SRMR = standardized root mean square residual.
*RMSEA Confidence Interval = 90%.
The data for this study came from self-report instruments, therefore it was tested for common method bias through the common latent variable method (Podsakoff, MacKenzie, & Lee, 2003). When running the test, and the varimax rotation failed to converge. These results indicate that common method bias is not a major concern for this study (Siegall & McDonald, 1995).
Overall, the factor structure of the model resulting from EFA was replicated during CFA. This indicated that data from the instrument were stable enough to move forward with Study 2, where CFA on the refined set of OSCS items were examined and the proposed nomological network was tested.
The purpose of Study 2 was to confirm reliability of the refined set of items and determine if a nomological network exists between the OSCS, the CCS, and the COI scales. This study utilized quantitative, correlational research design to confirm factor validity of data from the refined OSCS instrument on an independent sample and to examine nomological validity between data from the refined OSCS, the CCS, and the COI. Here again, survey methodology was used to gather information. Demographic data was collected for generalizability purposes.
As in Study 1, the population for this study consisted of students enrolled in at least one course at a higher education institution located in the United States. Participants were also identified through Qualtrics. The firm was again provided the sample size needed, the survey questions, and prescreening questions to ensure that participants met the criteria. A total of 580 surveys were sent, and 563 were attempted. Of the 563 attempted, 263 usable responses were obtained, representing a 46.71% response rate. Of those, 36.12% were male; 28.1% were undergraduates; and 10.6% were at the graduate-level.
Three instruments were utilized in this study: the revised OSCS from Study 1, the CCS, and the COI. Research exists to establish validity and reliability of data from the CCS and COI (Arbaugh et al., 2008; Bangert, 2009; Rovai, 2002b). Therefore, this was not calculated as part of Study 2.
The Classroom Community Scale (CCS). The CCS is a 20-item self-report scale that measures sense of community in a learning environment. The instrument contains two subscales, connectedness and learning, and contains statements such as I feel that students in this course care about each other and I feel that this course results in only modest learning. Each subscale contains 10 items and is responded to using a 5-point Likert scale ranging from 1 (strongly agree) to 5 (strongly disagree). Factor analysis studies provided evidence of construct validity (Rovai, 2002b). Data from the instrument reported α at.93 for the full scale and.92 and.87 for the subscales of connectedness and respectively (Rovai, 2002b).
The Community of Inquiry (COI) Scale. The COI is a 34-item self-report instrument that measures the dimensions of social presence, cognitive presence, and teaching presence in learning environments (Arbaugh et al., 2008). The scale contains items such as I was able to form distinct impressions of some course participants and c ombining new information helped me answer questions raised in course activities. Subscales for the COI include 9, 11, and 13 items respectively. Responses are reported on a 5-point Likert scale ranging from 0 (strongly disagree) to 4 (strongly agree). Literature supports that data from the instrument are valid, reliable, and efficient to measure the dimensions of social presence and cognitive presence, specific reliabilities for each subscale reported as follows: cognitive presence (α =.95), teaching presence (α =.96), and social presence (α =.91) (Arbaugh et al., 2008; Bangert 2009).
CFA was conducted to confirm the factor structure from Study 1. Convergent and divergent validity was established by calculating CR, AVE, and SIC (Henson, 2001; Nunnally, 1978; Paswan, 2009). Common method bias was also examined. Once the factor structure was confirmed, correlation analysis was used to assess the strength of the relationships for observed scale scores between factors from the OSCS and factors from the identified related constructs to determine nomological validity.
CFA using was conducted to confirm the structure from Study 1. Factor loadings for all items demonstrated acceptable thresholds (Nimon & Zigarmi, 2014).The model demonstrated acceptable fit, and all fit indices met their recommended thresholds (Byrne, 2010; Hooper et al., 2008; Kline, 2005). Model fit indices are shown in Table 3.
Table 3
Study 2 CFA Fit Indices for Measurement Model
| Goodness of fit measure | Recommended value | Default model |
| CMIN/df | > 3.0 | 2.44 |
| CFI | ≥ .95 | .954 |
| RMSEA* | ≤ .08 | .074 |
| TLI | ≥ .95 | .943 |
| SRMR | ≥ .08 | .056 |
Note. CMIN/df = chi-squared divided by degrees of freedom; CFI = comparative fit index; *RMSEA = root mean square error of approximation; TLI = Tucker-Lewis index; SRMR = standardized root mean square residual.
*RMSEA = 90% confidence level.
The range of CR (.58-.91) and AVE (.50-.72) provided evidence of adequate convergent validity. Shared variances between factors were lower than the associated SIC of individual factors, again providing evidence of discriminant validity. As in Study 1, data for Study 2 were tested for common method bias through the common latent variable method. Again, the varimax rotation failed to converge, indicating that common method bias is not a major concern for data used in this study (Siegall & McDonald, 1995).
The final part of this study was concerned with the establishment of a nomological network between factors included in the OSCS, CCS, and COI. To assess the strength of the relationships, strong correlation was indicated by.50 < | r |; moderate correlation was indicated by.30 < | r | <.50; and weak correlation was indicated by.10 < | r | <.30 (Ward, Fischer, Lam, & Hall, 2009). Table 4 shows correlations between factors in the OSCS, the COI, and the CCS.
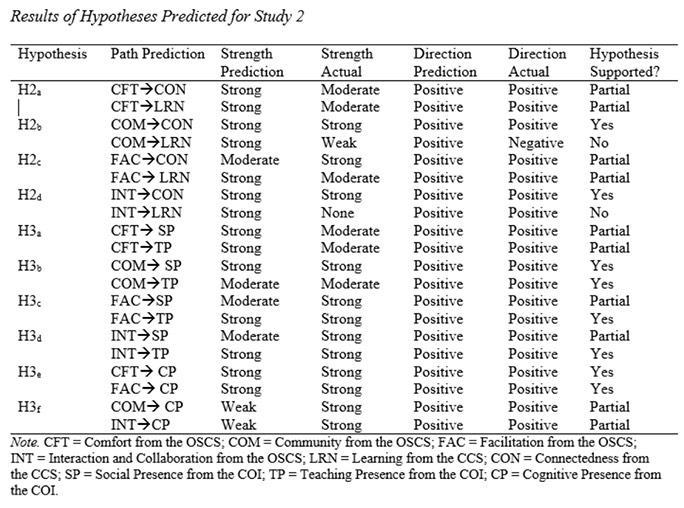
Results generally supported the theoretically based predictions put forth as part of the nomological network. Hypothesis H2 predicted that data from the OSCS would positively correlate to data from the CCS. This hypothesis was partially supported as an examination of data from these two instruments revealed that all correlations between the OSCS and the CCS were positive with the exception of community and learning (r = -.124, p =.001). Hypothesis H3 predicted that data from factors of the OSCS would correlate both positively and negatively with data from factors of the COI. This hypothesis was not supported because all correlations computed for data from these two scales were positive.
Table 4 Correlations between Factors in the OSCS, COI, and CCS
| Cognitive Presence | Connectedness | Learning | Teaching Presence | Social Presence | |
| Comfort | .521** | .378** | .426** | .458** | .430** |
| Community | .502** | .736** | -.124** | .436** | .635** |
| Facilitation | .611** | .602** | .351 | .752** | .653** |
| Interaction and Collaboration | .544** | .674** | .021 | .525** | .727** |
Note. ** Correlations significant at p <.001; *Correlations significant at p <.005.
Results for the remaining hypotheses in H2 and H3 varied. Details for individual hypotheses is shown in Table 5.
Table 5
Based on these results, the final nomological network model was altered. Figure 3 shows the final directional paths and strengths between factors form the OSCS, COI, and CCS.
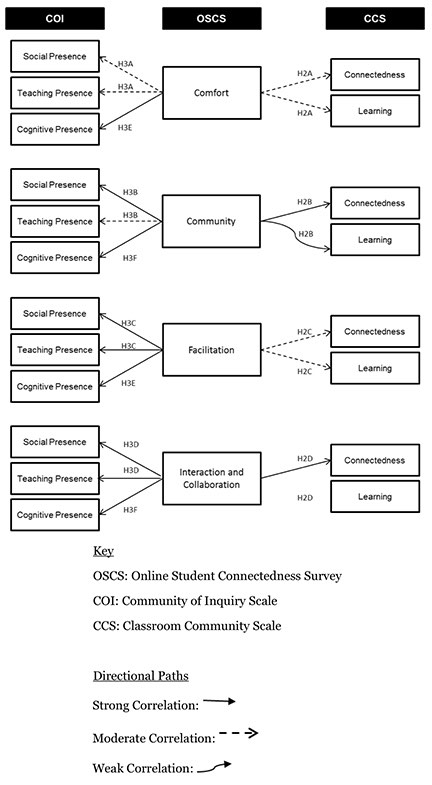
Figure 3. Final model for OSCS nomological network.
This study was undertaken to determine if the OSCS could hold promise for the academic and practitioner community as it relates to research for the design of online courses and the success and retention of students participating in this course modality. Research findings accomplished the task of providing evidence of factor validity, reliability, and the establishment of a nomological network for data gathered using the OCSC. This implies that the instrument may be useful in further research designed to study online student connectedness. The introduction of a reliable and valid scale to measure feelings of connection between students in online courses holds promise for a fresh perspective on this course format.
The finding that cognitive presence is highly correlated to feelings of connection may enhance future theories related to online learning. The opportunity to provide a framework that explores the integration between student connectedness in online courses and the level of cognitive presence will strengthen the research on the phenomena of how connectedness is achieved and sustained in the online educational environment. New theories devoted to the development of cognitive presence and the variables that influence this factor would also be useful.
This study added to the body of knowledge concerning the importance that the instructor plays in helping students develop feelings of connectedness in online courses. Instructors should work to encourage active participation between students in their courses. Their role should not simply be as spectator, but as an active participant in discussions and other activities designed to help students connect. This interaction could mitigate feelings of isolation among students in online learning environments and positively impact the student dropout rate.
Additionally, attention should be paid to the development of community in online courses. Forming a sense of community may take time; therefore, the course should be designed in a way that helps this bonding take place as quickly as possible. Immediate bonding can accomplished with course introductions between students and the instructor (Slagter van Tyron & Bishop, 2006). These introductions do not always need to take place on discussion boards. With the incorporation of social media into educational settings, institutions, and facilitators alike are encouraged to explore how technology such as Instagram and Vine might be used to help in this area.
One limitation of this study is the difference in teaching methods and styles of facilitators in online courses. It is suspected that the level of interaction between the facilitator and students might vary greatly depending on one's teaching style and experience with teaching in a virtual environment. These differences could have influenced participant responses to the questions, specifically those that were focused on facilitation and learning. A recommendation for future research is to determine if teaching style has an impact on the results of the data.
A second limitation of this study was that it relied on self-report data. Self-report data may provide unreliable results because of social desirability effects (Crockett, Schulenberg, & Petersen, 1987). The effects of social desirability can introduce bias, which can become a source of error in psychological and social science testing. Tests of social desirability attempt to measure the truthfulness of respondents during self-report studies (Crowne & Marlowe, 1960). A future recommendation would be to include a test of social desirability as part of the scale to mitigate this risk.
A main delimitation of this study was the sample. The sample was purposely limited to students located in and taking courses at 4-year universities in the United States to minimize errors related to cultural differences. In future studies, the sample could be expanded to include students outside of the United States. In doing so, the researcher would need to determine if cultural differences could be a factor in the results obtained. One way could determine if cultural differences are a factor by assessing manifest validity. Manifest validity studies how language is selected and combined into questionnaire statements during the creation of surveys (Larsen, Nevo, & Rich, 2008; Nimon, Shuck, & Zigarmi, 2015). Conducting a test of manifest destiny for the OSCS could help mitigate against cultural differences related to language when administering the survey among those to whom English is a second language.
Akyol, Z., Garrison, D. R., & Ozden, M. Y. (2009). Development of a community of inquiry in online and blended learning contexts. Procedia—Social and Behavioral Sciences, 1, 1834-1838. doi: 10.1016/j.sbspro.2009.01.324
Arbaugh, J. B., & Benbunan-Fich, R. (2007). The importance of participant interaction in online environments. Decision Support Systems, 43, 853-865. doi: 10.1016/j.dss.2006.12.013
Arbaugh, J. B., Cleveland-Innes, M., Diaz, S. R., Garrison, D. R., Ice, P., Richardson, J. C., & Swan, K. P. (2008). Developing a community of inquiry instrument: Testing a measure of the COI framework using a multi-institutional sample. Internet and Higher Education. 11, 133-136.
Bangert, A. W. (2009). Building a validity argument for the community of inquiry survey instrument. Internet and Higher Education, 12, 104-111.
Barnard-Brak, L., & Shiu, W. (2010). Classroom community scale in the blended learning environment: A psychometric review. International Journal on E-Learning, 9, 303-311. Retrieved from http://search.proquest.com/docview/62062456?accountid=7113
Bolliger, D. U. (2004). Key factors for determining student satisfaction in online courses. International Journal on E-Learning, 3(1), 61-67.
Bolliger, D. U., & Inan, F. A. (2012). Development and validation of the online student connectedness survey (OSCS). International Review of Research in Open and Distance Learning, 13(3), 41-65. Retrieved from http://www.irrodl.org/index.php/irrodl/index
Byrne, B. M. (2010). Structural equation modeling with AMOS: Basic concepts, applications, and programming. New York, NY: Routledge.
Crockett, L. J., Schulenberg, J. E., & Petersen, A. C. (1987). Congruence between objective and self-report data in a sample of young adolescents. Journal of Adolescent Research, 2, 383-392.
Crowne, D. P., & Marlowe, D. (1960). A new scale of social desirability independent of psychopathology. Journal of Consulting Psychology, 24, 349-354. doi: 10.1037/h0047358
Dawson, S. (2006). A study of the relationship between student communication interaction and sense of community. Internet and Higher Education, 9(3), 153-162. doi: 10.1016/j.iheduc.2006.06.007
Durvasula, S., Netemeyer, R. G., Andrews, J. C., & Lysonski, S. (2006). Examining the cross-national applicability of multi-item, multi-dimensional measures using generalizability theory. Journal of International Business Studies, 37, 469-483.
Ford, J. K., MacCallum, R. C., & Tait, M. (1986). The application of exploratory factor analysis in applied psychology: A critical review and analysis. Personnel Psychology, 39, 291-314.
Galambos, J.A., Abelson, R.P., & Black, J. B. (Eds.). (1986). Knowledge structures. Hillsdale, NJ: Erlbaum.
Garrison, D. R., Anderson, T., & Archer, W. (2000). Critical inquiry in a text-based environment: Computer conferencing in higher education. The Internet and Higher Education 2(2-3), 87-105. doi: 10.1016/S1096-7516(00)00016-6
Garrison, D. R., & Arbaugh, J. B. (2007). Researching the community of inquiry framework: Review, issues, and future directions. The Internet and Higher Learning. 10(3), 157-172.
Garrison, R. (2000). Theoretical challenges for distance education in the 21st century: A shift from structural to transactional issues. International Review of Research in Open and Distance Learning. (1) 1, 1-17. Retrieved from http://www.irrodl.org/index.php/irrodl
Hair, J. F., Black, W. C., Babin, B. J., & Anderson, R. E. (2010). Multivariate data analysis (7th ed.). Englewood Cliffs, NJ: Prentice Hall.
Henson, R. K. (2001). Understanding internal consistency reliability estimates: A conceptual primer on coefficient alpha. Measurement and Evaluation in Counseling and Development, 34, 177-189.
Henson, R., K., & Roberts, J., K. (2006). Use of exploratory factor analysis in published research: Common errors and some comment on improved practice. Educational and Psychological Measurement, 66, 393-416. doi: 10.1177/0013164405282485
Hooper, D., Coughlan, J., & Mullen, M. R. (2008). Structural equation modeling: Guidelines for determining fit. Journal of Business Research Methods, 6(1), 53-60.
Kline, R. B. (2005). Principles and practices of structural equation modeling (2nd ed.). New York, NY: Guilford.
Larsen, K. R., Nevo, D., & Rich, E. (2008). Exploring the semantic validity of questionnaire scales. Proceedings of the 41 st Hawaii International Conference on System Sciences. Waikoloa, HI: IEEE. doi: 10.1109/HICSS.2008.165
Matsunaga, M. (2010). How to factor-analyze your data right: Do's, don'ts, and how-to's. International Journal of Psychological Research, 3(1), 97-110.
McMillan, D. W., & Chavis, D. M. (1986). Sense of community: A definition and theory. Journal of Community of Psychology, 14, 6-23. doi: 10.1002/1520-6629(198601)14:1<6::AID-JCOP2290140103>3.0.CO;2-I
Nimon, K., Shuck, B., & Zigarmi, D. (2015). Construct overlap between employee engagement and job satisfaction: A function of semantic equivalence? Journal of Happiness Studies. doi: 10.1007/s10902-015-9636-6
Nimon, K., & Zigarmi, D. (2014). The work cognition inventory: Initial evidence of construct validity for the revised form. Journal of Career Assessment, 23(1), 117-135. doi: 10.1177/1060972714523241
Northrup, P. T. (2002). Online learners' preferences for interaction. Quarterly Review of Distance Education, 3(2), 219-226.
Nunnally, J.L. (1978). Psychometric theory. New York, NY: McGraw-Hill.
Ouzts, K. (2006). Sense of community in online courses. Quarterly Review of Distance Education, 7(3), 285-296. Retrieved from http://www.aect.org/Intranet/Publications/QRDE/subguides.html
Paswan, A. (2009, May). Confirmatory factor analysis and structural equations modeling: An introduction [PowerPoint slides]. Retrieved from http://www.cob.unt.edu/slides/paswan/ BUSI6280/CFA-SEM -Intro-May 18 2009.ppt
Petrie, T. A., Tripp, M. M., & Harvey, P. (2002). Factorial and construct validity of the body parts satisfaction scale-revised: An examination of minority and nonminority women. Psychology of Women Quarterly, 26(3), 213-221. doi: 10.1111/1471-6402.00060
Podsakoff, P. M., MacKenzie, S. B., & Lee, J. (2003). Common method biases in behavioral research: A critical review of the literature and recommended remedies. Journal of Applied Psychology, 88, 879-903. doi: 10.1037/0021-9010.88.5.879
Randolph, J. J., & Crawford, L. M. (2013). Factorial validity and reliability of the sense of community in online courses scale. Journal of Interactive Online Learning, 12(2), 53-69. Retrieved from http://www.ncolr.org/jiol/issues/pdf/12.2.2.pdf
Rao, K., Kaminska, O., & McCutcheon, A. L (2010). Recruiting probability samples for a multi-mode research panel with internet and mail components. Public Opinion Quarterly, 74(1), 68-84.
Rovai, A. P. (2002a). Building sense of community at a distance. The International Review of Research in Open and Distance Learning, 3(1), 1-16. Retrieved from http://www.irrodl.org/index.php/irrodl/index
Rovai, A. P. (2002b). Development of an instrument to measure classroom community. The Internet and Higher Education, 5( 3), 197-211. Retrieved from http://www.journals.elsevier.com/the-internet-and-higher-education/
Ryle, A., & Cumming, K. (2007). Reflections on engagement in online learning communities. International Journal of Pedagogies and Learning, 3(3), 34-46. doi: 10.5172/ijpl.3.3.35
Sheehy, K. (2012, January 10). U.S. news ranks top online degree programs. U.S. News & World Report. Retrieved from http://www.usnews.com/education/online-education/articles/2012/01/10/us-news-ranks-top-online-degree-programs
Shin, N. (2003). Transactional presence as a critical predictor of success in distance learning. Distance Education, 24(1), 69-86. doi: 10.1080/0158791032000066534
Short, J. A., Williams, E., & Christie, B. (1976). The social psychology of telecommunications. London, England: Wiley.
Siegall, M., & McDonald, T. (1995). Focus of attention and employee reactions to job change. Journal of Applied Social Psychology, 25, 1121-1141. doi: 10.1111/j.1559-1816.1995.tb02610.x
Slagter van Tryon, P. J., & Bishop, M. (2006). Identifying "E-mmediacy" strategies for web-based instruction: A Delphi study. Quarterly Review of Distance Education, 7(1), 49-62. Retrieved from http://wwwaect.org/Intranet/Publications/QRDE/subguides.html
Slagter van Tryon, P. J., & Bishop, M. (2009). Theoretical foundations for enhancing social connectedness in online learning environments. Distance Education, 30(3), 291-315. doi: 10.1080/01587910903236312
Tait, R. C., Chibnall, J. T., & Krause, S. (1990). The pain disability index: Psychometric properties. Pain, 40(2). 171-182.
Tu, C., & McIsaac, M. (2002). The relationship of social presence and interaction in online classes. American Journal of Distance Education, 16(3). 131-150. doi: 10.1207/S15389286AJDE1603_2
Walther, J. B. (1992). Interpersonal effects in computer-mediated interaction: A relational perspective. Communication Research, 19(2), 52-90.
Ward, C., Fischer, R., Lam, F. S. Z, & Hall, L. (2009). The convergent, discriminant, and incremental validity of scores on a self-report measure of cultural intelligence. Educational and Psychological Measurement, 69, 85-105.
Worthington, R. L., & Whittaker, T. A. (2006). Scale development research: A content analysis and recommendations for best practices. Counseling Psychologist, 34, 806-838.
Young, S. (2006). Student views of effective online teaching in higher education. American Journal of Distance Education, 20(2), 65-77. doi: 10.1207/s15389286ajde2002_2
![]()

The Online Student Connectedness Survey: Evidence of Initial Construct Validity by Tekeisha Zimmerman and Kim Nimon is licensed under a Creative Commons Attribution 4.0 International License.