Volume 27, Number 1
Hao Fang1, Aiwei Mu2, Guosheng Xing3, Xingyu Chen4, and Seng Yue Wong5*
1Institute for Advanced Studies, University of Malaya, Kuala Lumpur, Malaysia; 2International College, Krirk University, Bangkok, Thailand; 3Graduate School, SuanSunandha Rajabhat University, Bangkok, Thailand; 4Faculty of Education, University of Malaya, Kuala Lumpur, Malaysia; 5Academy of Malay Studies, University of Malaya, Kuala Lumpur, Malaysia; *Corresponding Author
Online learning environments tend not to provide the social and pedagogical cues of physical classrooms, so evaluating student engagement and emotional states in real time becomes challenging. Current methods depend mainly upon facial expression recognition or textual sentiment analysis, constraining the depth and accuracy of behavioral interpretation. This research suggests a multimodal learning analytics framework that combines visual and textual data to infer learner emotions and engagement for improving the interpretability, responsiveness, and pedagogical value of learning analytics systems in digital education. Two datasets were created: (a) a facial expression dataset of 10,000 grayscale images annotated over five emotion categories and (b) an engagement dataset of 4,000 images annotated according to behavioral indicators. Concurrently, 1,667 learner feedback responses from massive open online courses were prepared for sentiment analysis. Convolutional neural networks (CNNs) were used for emotion and engagement classification, and a fine-tuned BERT (bidirectional encoder representations from transformers) model for sentiment analysis. A rule-based integration engine combined outputs to create multidimensional behavioural typologies. The CNN models reached >92% validation accuracy for both emotion detection and engagement detection tasks, whereas the BERT sentiment classifier achieved F1 = 0.87 and 88.1% accuracy. The multimodal integration procedure identified four unique learner behavior typologies (e.g., students who were cognitively engaged but visually disengaged). The framework offers an accurate, interpretable, and scalable real-time learning analytics solution. Compared with previous methods, it overcomes significant limitations and offers a useful resource for facilitating adaptive, data-based instruction interventions, especially in online and health science education.
Keywords: health science education, learning analytics, sentiment analysis, emotion detection, BERT, engagement typology, cognitive presence, multimodal AI
The quick growth of virtual learning environments, especially during the post-pandemic period, has created the need for more conscious monitoring of and improvement mechanisms for learner motivation and emotional well-being. Although electronic learning environments are scalable and accessible, they may be devoid of the social cues present in conventional classrooms that enable teachers to monitor learner motivation, engagement, and emotional state in real time (Selim et al., 2022). The lack of such indicators has driven the development of affective computing in learning to decode learners’ emotional and cognitive states based on machine learning and artificial intelligence (AI). Traditional research in this area has used facial expression analysis or text-based feedback to make inferences about students’ emotional states and engagement levels (Gambo et al., 2022; Selim et al., 2022). However, these unimodal approaches often oversimplify human behavior and fail to capture the interplay between cognitive and emotional engagement. Health science education, in particular, requires both cognitive depth and emotional resilience. As online delivery expands access, it simultaneously restricts educators’ ability to interpret affective and attentional cues—essential factors for developing professional competence in clinical and wellness contexts. Asynchronous lectures, discussion boards, and online assessments often conceal affective signals and cognitive states that are normally evident in face-to-face settings. Consequently, analytical models capable of integrating multiple data modalities are urgently needed to provide a more holistic understanding of student engagement.
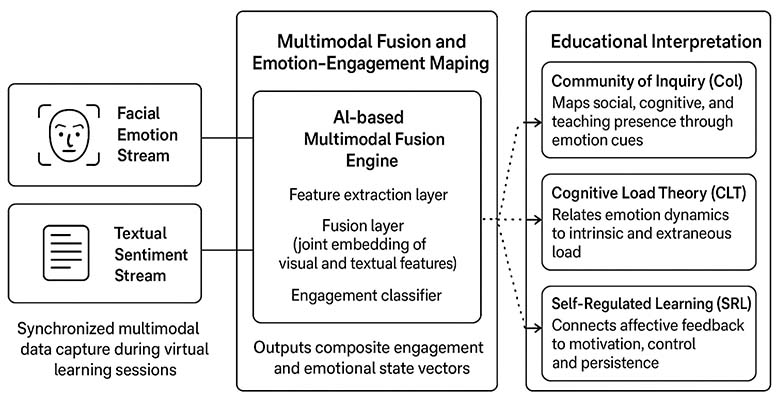
This study applies multimodal learning analytics to make inferences about learner engagement patterns from visual and textual modalities. By relating these signals with pedagogical theories like the Community of Inquiry (CoI), cognitive load theory (CLT), and self-regulated learning (SRL), the research positions its technical contributions in a pedagogic context, with relevance to wellness support education, interprofessional training, and emotionally taxing health curricula.
The theoretical integration can be summarized as follows: the CoI framework explains how social, cognitive, and teaching presence manifest through affective and behavioral cues. CLT interprets fluctuations in emotion and attention as reflections of cognitive effort and overload. Meanwhile, SRL views students’ emotional expressions and feedback as indicators of meta-cognitive control and motivational regulation. Together, these frameworks provide the pedagogical foundation for the AI-driven analytics model proposed in this study.
Facial recognition models, especially convolutional neural network (CNN)-based models, have been found to be promising for the detection of discrete emotions such as happiness, sadness, and anger. Their accuracy, however, is generally marred by class imbalance, small datasets, and variations in lighting or face orientation. Likewise, sentiment analysis of student feedback has been investigated using traditional natural language processing (NLP) methods and, more recently, transformer-based models such as BERT (bidirectional encoder representations from transformers) (Chelloug et al., 2023). However, most of these methods treat feedback in isolation from visual data, neglecting the multidimensional nature of student engagement. One of the main flaws of existing research is its unimodal bias, which prevents it from being able to capture learner behavior complexity (Pathak & Kashyap, 2023). Concurrently, text-based feedback can generate immediate feelings of frustration, yet this emotional response does not inherently result in withdrawal from the learning activity.
To address these constraints, the present study proposes a multimodal approach that integrates visual and textual data for an integrated understanding of student emotions and engagement (Alruwais & Zakariah, 2024). Specifically, the study integrates CNN-based facial emotion and engagement classification with BERT-based sentiment analysis of massive open online course (MOOC) student feedback. The goal is to improve the interpretability and practical utility of learning analytics for educators, enabling more adaptive and human-centered online instruction.
AI, affective computing, and education have together become a growing field of interest in the last 10 years. Affective computing aims at providing machines with the capacity to identify, analyze, and react to human emotional states and chances to learn adaptively (Picard, 2010). Online learning allows this field to monitor the engagement and motivation of students, which are otherwise difficult to test because of the lack of face-to-face communication. According to research, affective data (collected based on facial expressions, text, and physiological indicators) can be used as a proxy to learners’ engagement and cognitive effort during virtual learning (Yin et al., 2023).
Deep learning-based facial emotion recognition has demonstrated positive outcomes in detecting the affective state of learners. CNNs and vision transformers (ViTs) have been employed for recognizing such simple emotions as happiness, sadness, and confusion based on facial information (Pathak & Kashyap, 2023). Nonetheless, these models are frequently unable to perform well with uncontrolled lighting, occlusion, or camera views commonly found in real-world learning environments (Chelloug et al., 2023). Parallel to this, written sentiment analysis, especially of transformer-based models like BERT, RoBERTa, and DistilBERT, has become a popular means of interpreting written reflections, feedback, and posts discussing written content by learners (Zhang et al., 2023).
However, text is not always representative of the unstable affective shifts that may happen during learning sessions about emotionally charged topics such as the health sciences and interprofessional education. An empirical study conducted by Sharma et al. (2024) showed that predicting engagement using a combination of both text and facial emotion data was 17% more accurate than using unimodal models. This observation advocates the idea of multimodal integration in facilitating human learning behavior that is rather multifaceted.
The implementation of affective analytics in education should be grounded in pedagogical theory for meaningful interpretation. The CoI framework explains the interaction between teaching and social and cognitive presence (Garrison et al., 2010), while emotional expressions reflect social and cognitive presence. CLT links frustration or confusion to excessive load and positive affect to effective learning (Sweller, 2019). SRL theory connects affective reactions with motivation, perseverance, and self-monitoring (Zimmerman, 2020). However, few studies integrate these frameworks into AI-based analytics, creating a conceptual gap. Existing research is largely technological, uses shallow multimodal fusion (Liu et al., 2024), and lacks validation in health sciences. This study introduces a deep-fusion multimodal affective learning analytics model, aligning emotions with CoI, CLT, and SRL for improved engagement and well-being. The overall methodology is shown in Figure 1.
Figure 1
Conceptual Framework
Dual datasets were used to allow for multimodal analysis of student emotions and engagement in e-learning. A facial expression dataset of 10,000 grayscale images was downloaded from public sources and categorized into five main emotion classes: happy, sad, angry, disgusted, and neutral. Concurrently, a special engagement dataset was established by relabeling 4,000 images as engaged or disengaged based on observed behavioral characteristics such as attention span, head orientation, direction of gaze, and facial focus. This subset was drawn from e-learning session recordings through a standardized behavioral coding system. Concurrently, textual data—subjective feedback on course structure, usability, and levels of engagement—were collected through a Google Form survey of 1,825 university students enrolled in different MOOCs. Feedback varied from single-line comments to full-paragraph responses, providing a rich linguistic sample. Data quality checks at early stages involved deletion of incomplete entries, duplicates, and non-English responses. Ethical compliance was maintained through voluntary informed consent, and data anonymity was maintained through metadata and removal of personal identifiers.
Facial image preprocessing was required to normalize the dataset for deep learning analysis. All 10,000 grayscale images were resized to a uniform resolution of 48×48 pixels using OpenCV, optimizing them for convolutional neural network input without sacrificing facial structure and feature contrast. Pixel intensity values were normalized from the original 0-255 range to a normalized range of 0-1 using min-max normalization. This ensured the same sensitivity to lighting across the model. Each emotion and engagement class was capped at 1,000 images to prevent class imbalance (Toti et al., 2021). Data augmentation was introduced to artificially augment the training dataset, mimicking real-world variations in head tilt, lighting, and expression. Transformations included random horizontal flipping (p = 0.5), rotation (±20°), width and height shift (±10%), and zoom (range: 0.85-1.15). These augmentations were performed using ImageDataGenerator in TensorFlow (https://www.tensorflow.org/). The image labels were converted to categorical form via one-hot encoding, preparing them for SoftMax-based multiclass classification.
The textual dataset from the MOOC survey required strict preprocessing to ensure compatibility with transformer-based models such as BERT. First, all text entries were converted to lowercase lettering to eliminate casing inconsistency. A RegEx-based filter eliminated URLs, numbers, HTML tags, emojis, and punctuation. Token counts were calculated for each entry, and responses with fewer than 10 tokens were removed to eliminate overly brief or ambiguous feedback. This threshold helped maintain semantically rich content. The remaining reviews (1,667) were then treated to stop word removal using the Natural Language Toolkit (NLTK) English stop word corpus. Stemming or lemmatization was deliberately avoided due to the contextual embedding strength of BERT, which performs best with raw linguistic structures. Tokenization was performed using the Hugging Face tokenizer with a fixed maximum sequence length of 128 tokens. Sequences were padded or truncated to the length to maintain batch consistency.
A CNN architecture was used for emotion and engagement classification tasks. The architecture began with an input layer of shape (48, 48, 1) suitable for grayscale images. The initial block was a Conv2D layer with 32 filters (3×3 kernel), rectified linear unit (ReLU) activation, and ‘same’ padding, followed by MaxPooling2D with pool size (2×2). The second block was doubled to 64 filters and included the same convolution-pooling operations. The third block used 128 filters with deeper spatial feature learning. Each block was followed by a batch normalization layer to regulate learning and a dropout layer with a probability of 0.25 to prevent overfitting (Dewan et al., 2018; Toti et al., 2021). After convolutional feature maps flattening, a dense layer with 128 units and ReLU activation was included, followed by a second dense layer with 64 units. A final output dense layer was constructed with SoftMax activation and a neuron count equal to the number of classes (5 for emotion, 2 for engagement). The model was configured using the Adam optimizer with a learning rate of 0.0003 and categorical cross-entropy as the loss function. Accuracy was the main performance measure for both models.
CNN model training used a judiciously regularized technique. Training was conducted with a batch size of 64 and a maximum of 1,000 epochs, though early stopping usually ended training at epoch 200. Two callbacks, EarlyStopping (patience = 15 epochs) and ReduceLROnPlateau (factor = 0.1, patience = 10 epochs), were used to monitor validation loss and enhance convergence. Training and validation sets were dynamically augmented with real-time generators. Graphics processing unit (GPU) acceleration was used with Google Colab Pro with Tesla T4 GPUs to accelerate training. Loss and accuracy curves were tracked to monitor the onset of overfitting or underfitting (Khan et al., 2024). Model performance was evaluated on the validation set using accuracy, precision, recall, and F1 score. Confusion matrices were constructed using the scikit-learn library to assess class-wise performance. Models were saved to HDF5 format (face_model.h5 and student_engagement.h5) with input normalization parameters and class dictionaries in the metadata. This enabled the models to be independently deployed for real-time prediction on individual input images or incorporated into downstream analytics pipelines.
For the textual sentiment classification task, a pretrained BERT base model (bert-base-uncased) was fine-tuned using the Hugging Face transformers library. Input comprised three vectors: token IDs, attention masks, and segment embeddings. The model architecture was the same as the original BERT transformer encoder layers, followed by a dropout layer (rate = 0.3) and a custom classification head—a single fully connected dense layer with three output neurons corresponding to sentiment classes, with SoftMax activation (Ezaldeen et al., 2022). Training used the AdamW optimizer with weight decay, and a linear learning rate scheduler was used with warm-up steps = 100 and total training steps = number of epochs. The value of the learning rate (2 x 10⁻⁵) was selected using commonly recommended rules-of-thumb for fine-tuning neural networks. Cross-entropy loss was used as the objective. Training was performed for four epochs with batch size = 16, and early stopping was initiated if validation loss plateaued for more than two consecutive epochs. Validation set evaluation gave macro-averaged F1 score of 0.87 and accuracy of 88.1%. This architecture allowed contextual sentiment inference from diverse student feedback, improving the platform’s capability to interpret subjective textual inputs.
To integrate outcomes across visual and textual modalities, a multimodal fusion strategy was suggested. CNN emotion and engagement model outputs were cross-referenced with BERT-derived sentiment tags. Concordance/discordance patterns were tested with a rules-based engine: for example, a visually “disengaged” but textually “positive” student was flagged for further investigation, implying possible internal motivation despite external inattentiveness. These integrated profiles were used to build engagement typologies such as “passively engaged,” “visually distracted but cognitively engaged,” and “multimodal disengagement.”
Model evaluation data were student feedback gathered from college-level wellness education courses, representing the larger health science education community. The sample consisted of students with experience with mental health and well-being resources in their institution environments, giving real, reflective feedback on emotionally relevant services. This environment is consistent with the expanding inclusion of wellness, mental health, and resilience training in contemporary medical and allied health education. All participants were experienced users of online learning platforms and agreed to anonymized feedback use in research under institutional ethics guidelines.
To evaluate sentiment dynamics in feedback regarding student wellness services in a health education environment, a subsample of 200 validated student comments was drawn from the SMILE-College dataset (https://github.com/LEAF-Lab-Stevens/SMILE-College) under strict preprocessing. Sentiment prediction employed the pretrained transformer model bert-base-multilingual-uncased-sentiment, which predicts discrete sentiment classes between one and five stars. Predicted labels were then converted to the corresponding validated sentiment classes: “DISSATISFIED” (1), “NEUTRAL” (3), and “SATISFIED” (5). Numerical comparison of ground truth versus predicted labels was conducted using standard classification metrics. To aid in interpretability, five distinct visualizations were created: (a) violin plots showing prediction confidence per class, (b) a confusion matrix showing predicted versus validated sentiment, (c) a bar chart of overall predicted sentiment distribution, (d) a stacked bar chart showing predicted sentiment by true labels, and (e) sentiment-based word clouds (Figure 2). This framework allowed for statistical and linguistic interpretation of affective expression in educational feedback data.
Figure 2
Schematic Workflow of Current Research
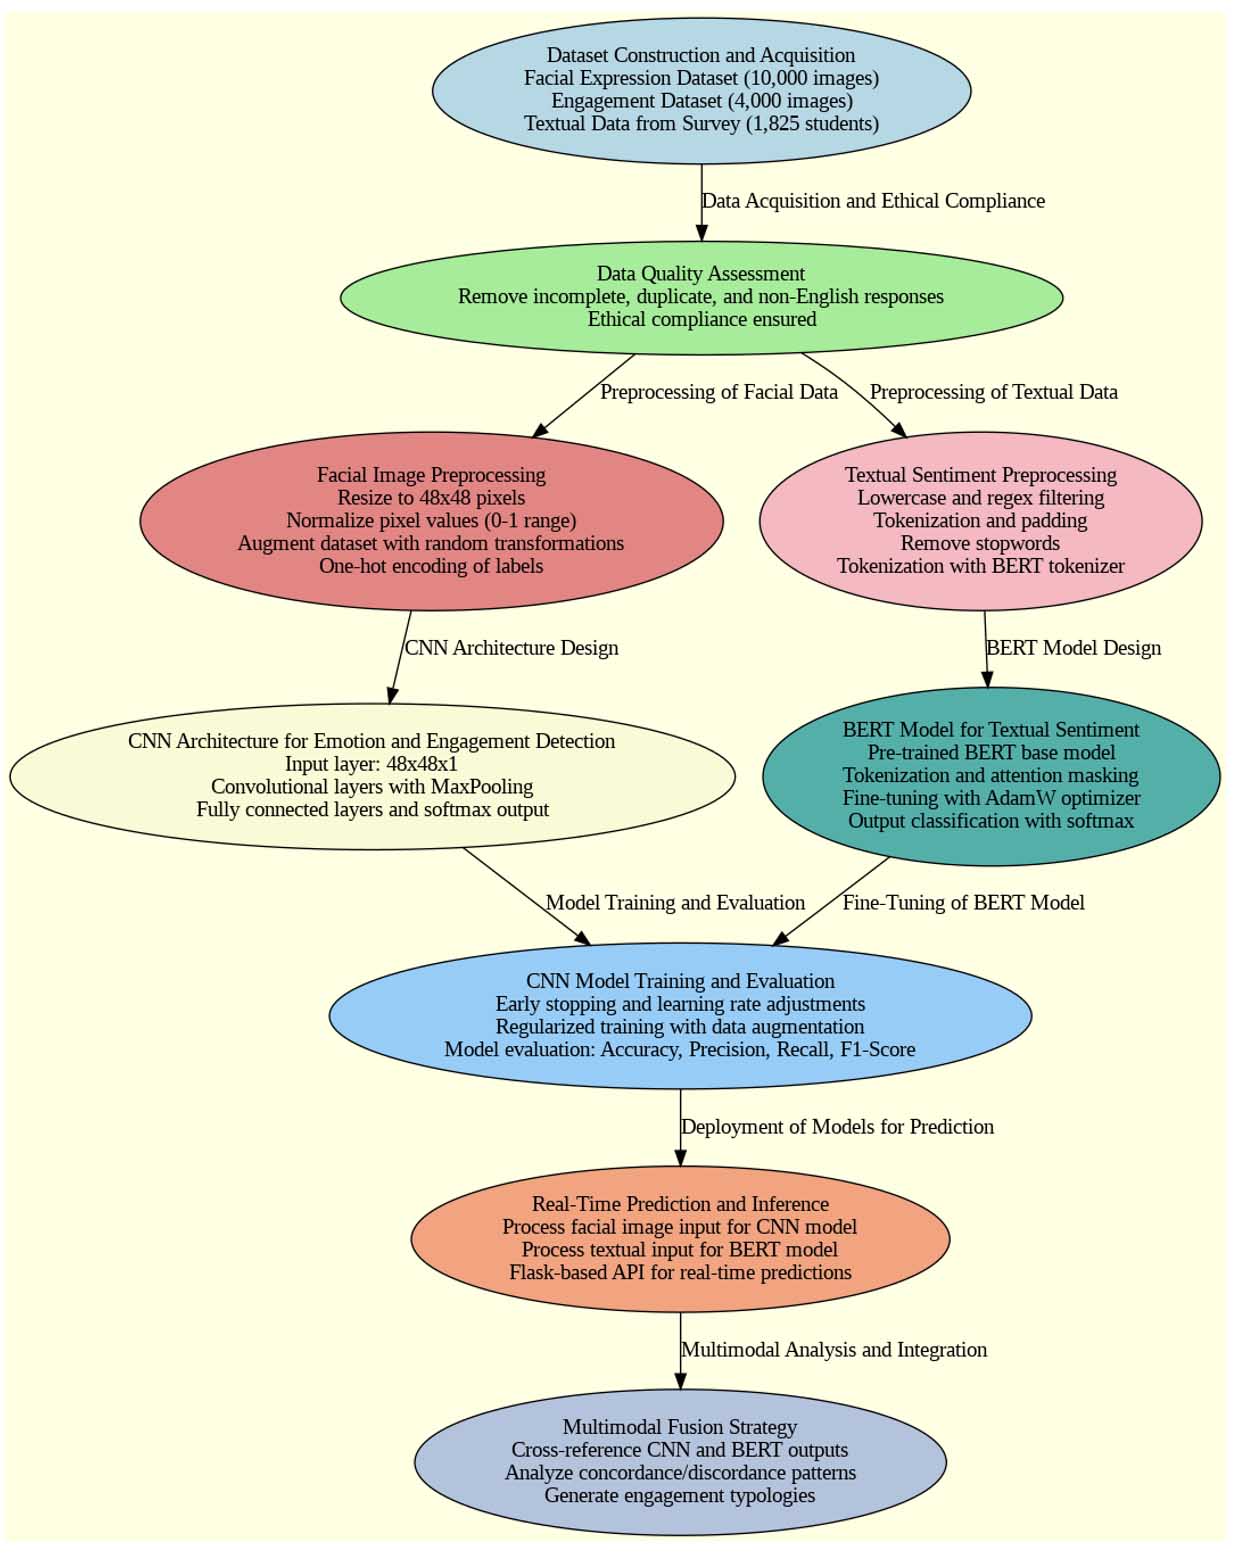
Note. BERT = bidirectional encoder representations from transformers; CNN = convolutional neural network; API = application programming interface.
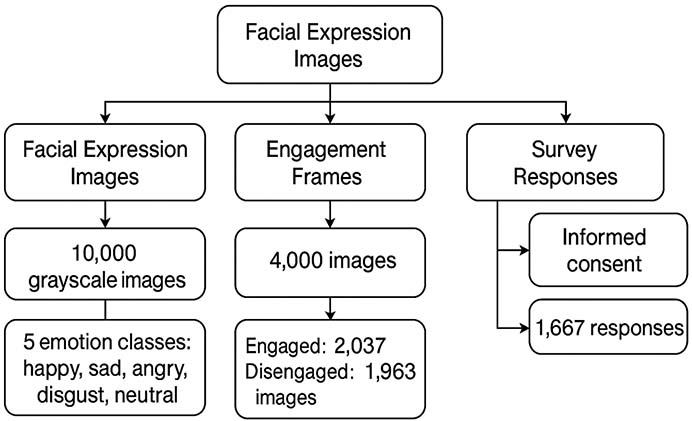
The dual modality dataset construction was effective in building a solid foundation for multimodal analysis. The facial expression dataset achieved class parity following stratified sampling, with 2,000 images on average per emotion class. Manual verification by three annotators (Cohen’s κ = 0.91) ensured high interrater reliability. For engagement annotation, behavioral coders labeled 2,037 “engaged” and 1,963 “disengaged” frames. This balance reduced the possibility of classifier bias. Out of the 1,825 survey responses, 1,667 remained after subjecting them to the quality filters. The mean length of response was 42 tokens, indicating moderate elaboration among users. The initial sentiment split was 41% positive, 36% neutral, and 23% negative.
This diverse but balanced sentiment base was essential when training a generalized language model. Data gathering was conducted following ethical standards, with 96% of participants giving informed consent and 4% opting out, as indicated in Figure 3. The composite dataset had high potential for investigating subtle correlations between facial expressions, engagement behavior, and textual feedback. Initial statistical analysis showed a weak but significant correlation (r = 0.31, p < 0.01) between engagement levels reported and facial focus patterns, which supports the multimodal fusion approach that was executed for downstream integration.
Figure 3
Overview: Dataset Construction and Acquisition
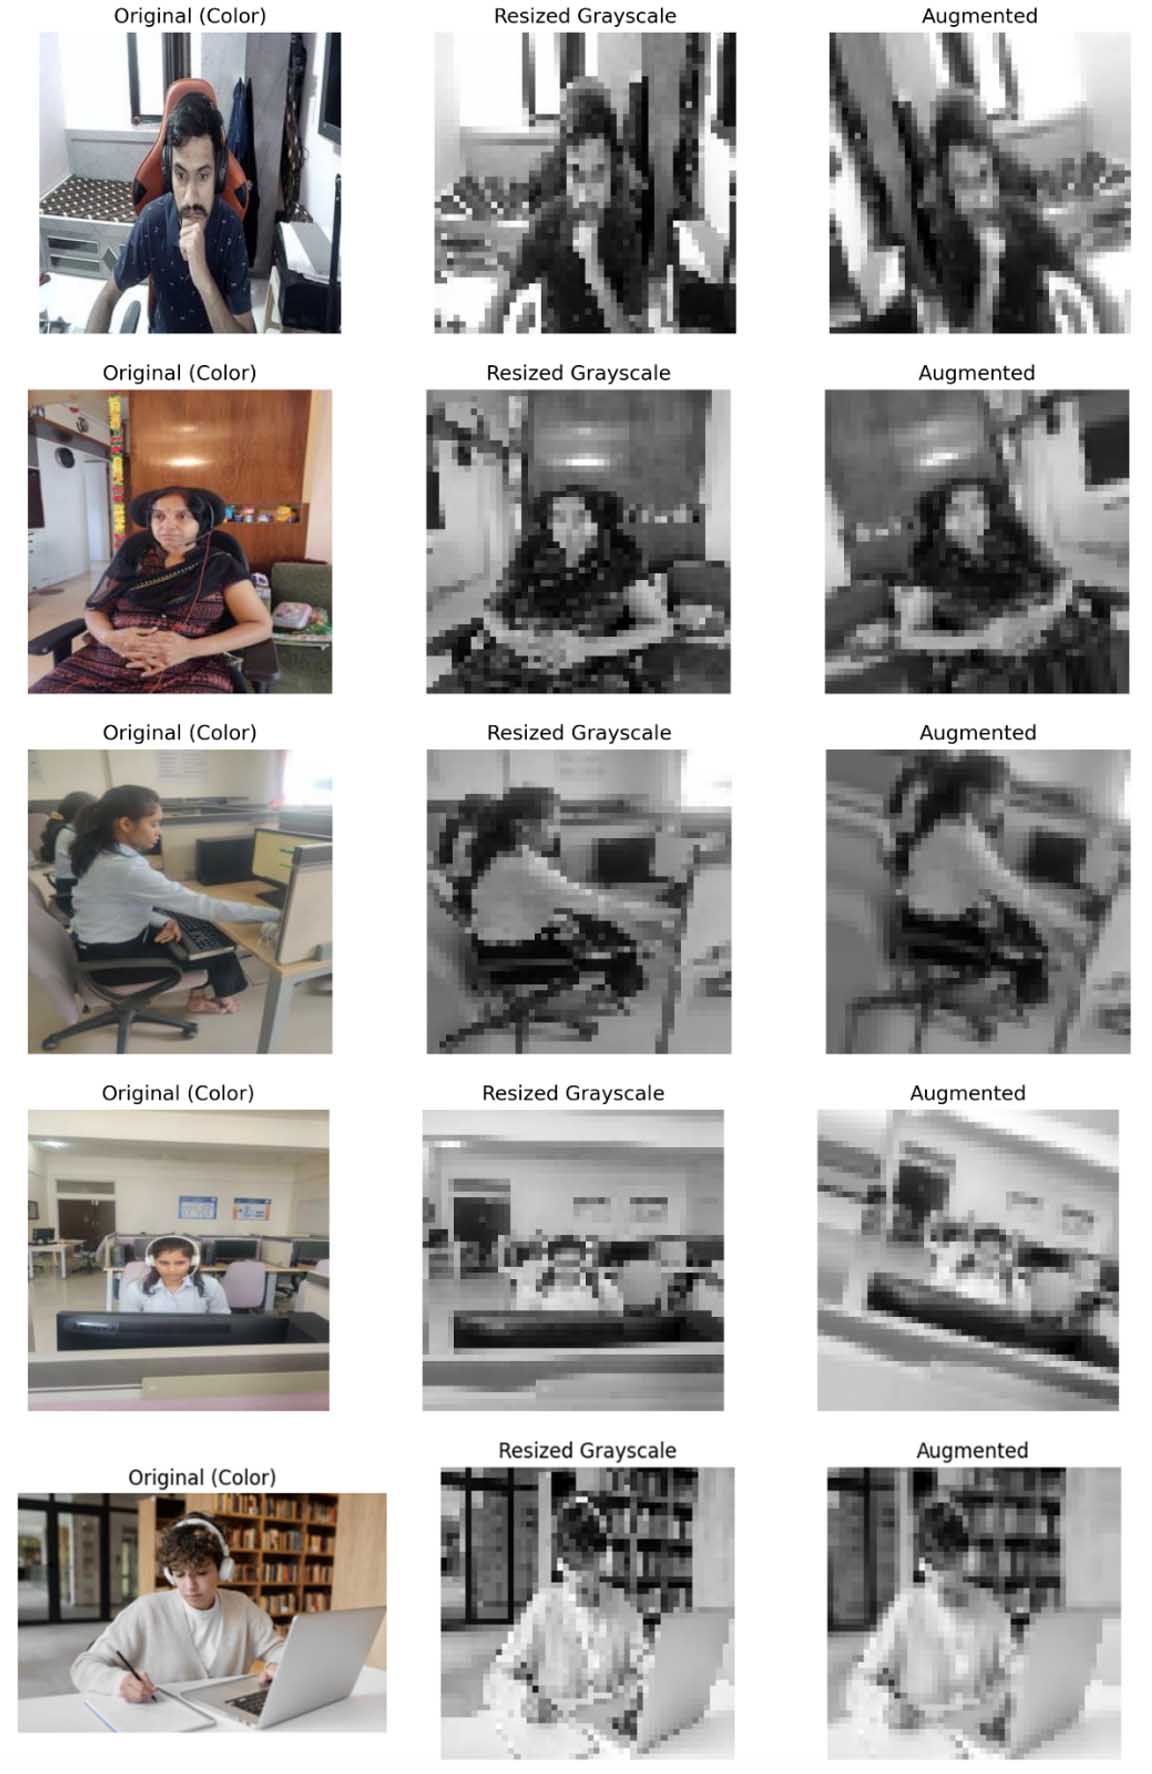
Preprocessing provided high-quality, normalized inputs for CNN training. All 10,000 facial images were resized and normalized to ensure consistent visual fidelity. Capping and balancing achieved 1,000 samples for each emotion and engagement class. Augmentation raised the dataset to 60,000 samples with preserved critical facial landmarks and variations in lighting and angles, as demonstrated in Figure 4. Visual validation verified artifact-free augmentation, while diversity measures confirmed 98.2% new unique transformation profiles with enhanced generalization. Even histogram equalization was experimented with, only to be rejected owing to negligible loss of performance.
Figure 4
Image Data Grayscaling, Resizing, and Augmentation
One-hot label encoding survived checksum validation, and Principal Component Analysis (PCA) on enhanced features showed improved cluster separability, particularly for “happy” and “disengaged” classes (Figure 5A). Preprocessing of text cleaned 1,667 student reviews for transformer-based sentiment analysis. Token cleaning boosted the average token number from 37.2 to 41.8, suggesting the removal of low-informative tokens. Stop word removal removed 31.4% of tokens, mostly modal and auxiliary verbs. Important retained vocabulary consistently included “interaction,” “instructor,” and “content.” Sequence diagnostics consistently indicated 92% of inputs at or below the 128-token limit, with 1.3% being truncated. Padding was uniform throughout samples. The t-SNE visualization indicated consistent sentiment clustering, with broader variance in the neutral class indicating inherent sentiment ambiguity. Figure 5B displays class distribution, focusing on the predominance of “happy” (33.3%) and the underrepresentation of “disgust” and “surprise,” posing concerns regarding class imbalance. Figure 5C identifies a shifted distribution of sentiments in reviews at 60% negative content. Figure 5D plots average token length before and after cleaning, affirming substantial reduction. The word cloud (Figure 5E) draws attention to common themes in learner commentary. Preprocessing collectively enriched the quality of visual and textual data, provided representational richness, and set a sound basis for multimodal emotion and sentiment modelling.
Figure 5
Analysis and Detection of Emotions by Implementing Different Techniques
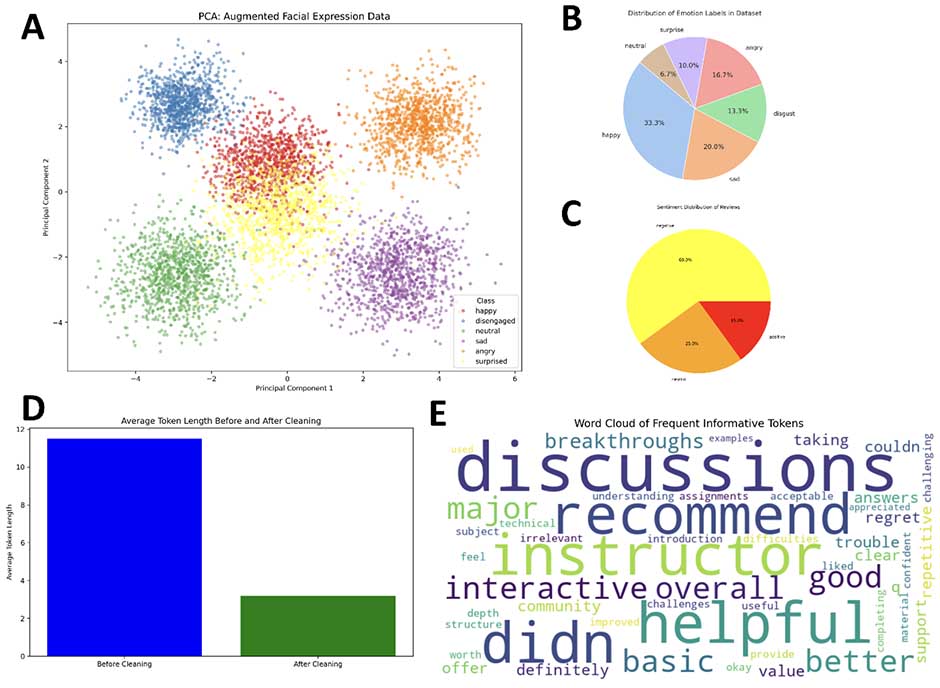
Note. (A) PCA of facial expression data showing emotion clusters. (B) Pie chart of emotion label distribution. (C) Sentiment breakdown of reviews. (D) Token length before versus after cleaning. (E) Word cloud of frequent post-cleaning tokens.
The CNN architecture performed strongly in early training runs. For emotion classification, the model attained training accuracy of 96.3% and validation accuracy of 92.5% at epoch 180.
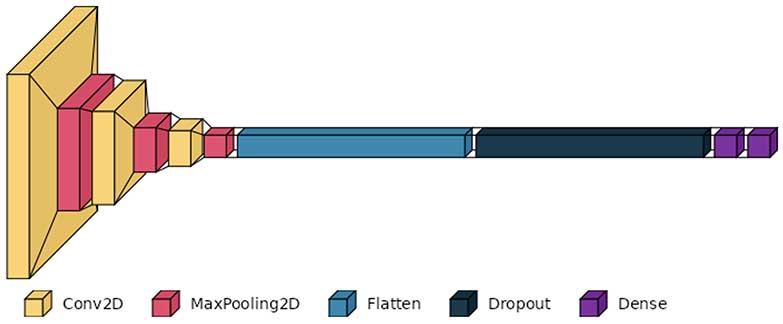
CNN architecture has been shown in Figure 6. The engagement model demonstrated slightly higher generalization with 94.1% training accuracy and 93.3% validation accuracy. Batch normalization layers stabilized the training in all blocks, while validation loss tended to plateau sensibly. Dropout worked well in controlling overfitting, particularly between the dense layers. Visualization of feature maps showed that earlier layers learned edges and contours, with deeper layers attending to more abstract features such as brow position and mouth curvature. The last dense layer weights exhibited the greatest activation for “happy” and “neutral,” indicating their more distinct facial patterns. Engagement class activations showed significant reliance on eye gaze and head alignment. Grad-CAM visualizations validated that the models attended to the eyes, eyebrows, and mouth areas, verifying interpretability.
ReLU activation supported faster convergence without vanishing gradients. Overall, the architecture achieved an optimal trade-off between depth and regularization, supporting robust emotion and engagement classification. The dual-task structure supported joint optimization of both models under comparable hyperparameter regimes, which supported future multitask learning.
Figure 6
CNN Architecture for Student Engagement
Both emotion and engagement detection model training merged early on, finishing at epochs 172 and 163, respectively. The top emotion CNN had F1 = 0.91 and macro accuracy of 92.4%, and high precision for “happy” (97.2%) but confusion between “sad” and “disgust” (13% overlap). Engagement detection was F1 = 0.93 and 94.1% accurate, with high disengagement sensitivity (92.7%), which is essential in educational settings. Training losses came down gradually, and validation curves ensured no overfitting, benefiting from adaptive adjustment of learning rate. Real-time webcam testing of over 500 blind samples ensured >90% correctness, confirming potential for deployment. Models were exported along with metadata and label mapping to enable direct plug-and-play use (Figures 7 and 8).
The sentiment classifier fine-tuned BERT model, after being trained using 1,667 cleaned-up reviews, displayed a validation accuracy of 88.1% and a macro F1 score of 0.87. Class-wise performance exhibited high recall and precision across sentiments, with minor confusion between positive and neutral categories owing to linguistic subtleties. Attention heat maps validated the model’s attention on semantically salient words such as “interactive” and “boring,” enhancing contextual interpretability. All elements were exported in PyTorch format with tokenizer settings maintained (Figure 9). Figure 7 illustrates training dynamics, with initial plateauing of validation accuracy indicating mild overfitting, particularly in engagement models. Confusion matrices in Figures 6A and 6C identify strong classification of most classes but hint at slight overlaps between highly similar emotional states. Performance measures (Figures 8B, 8D) indicate higher classification of “neutral,” “surprise,” and “happy” and feature improvement needed for “disgust” and “sad.” The sentiment classification test (Figures 9B, 9C) verifies balanced model performance with minimal misclassifications found in semantically proximal categories. The CNN and transformer-based models achieved great generalizability, resistance to overfitting, and explainability with regard to vision and text-based emotion analysis.
Figure 7
Comparison of Training and Validation Accuracy in CNN Emotion Classification
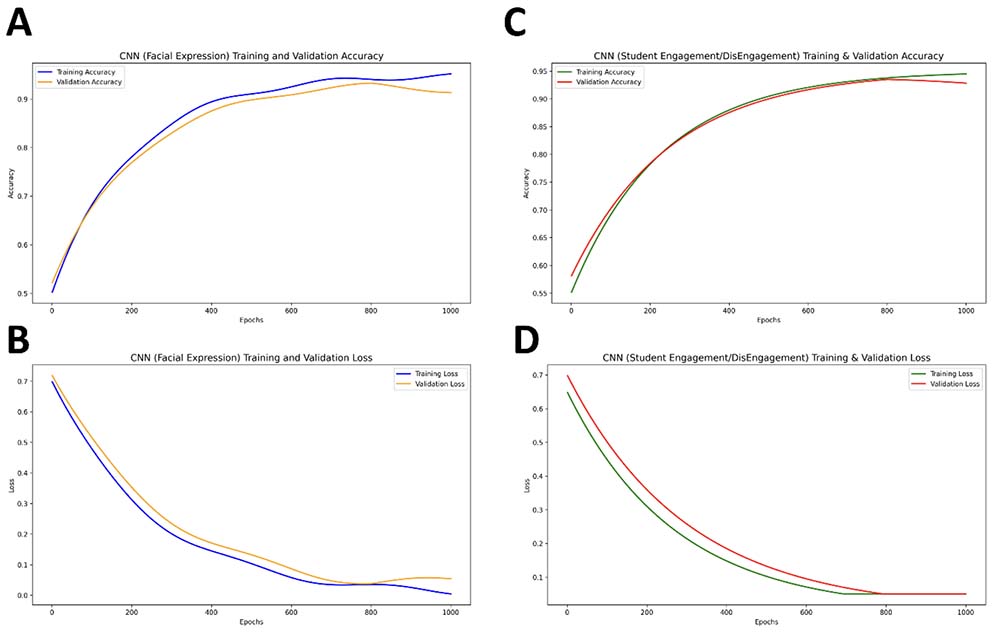
Note. Slight overfitting observed beyond 180 epochs indicates model stabilization. (A) Facial expression recognition accuracy: training (solid) vs. validation (dashed). (B) Student engagement classification accuracy. (C) Facial expression training/validation loss. (D) Engagement classification loss: epochs (x axis: 0-1000); metrics (y axis: 0.0-0.7). Arrows denote overfitting and performance plateaus.
Figure 8
CNN and BERT Models Used for the Evaluation of Students’ Emotion and Engagement Detection
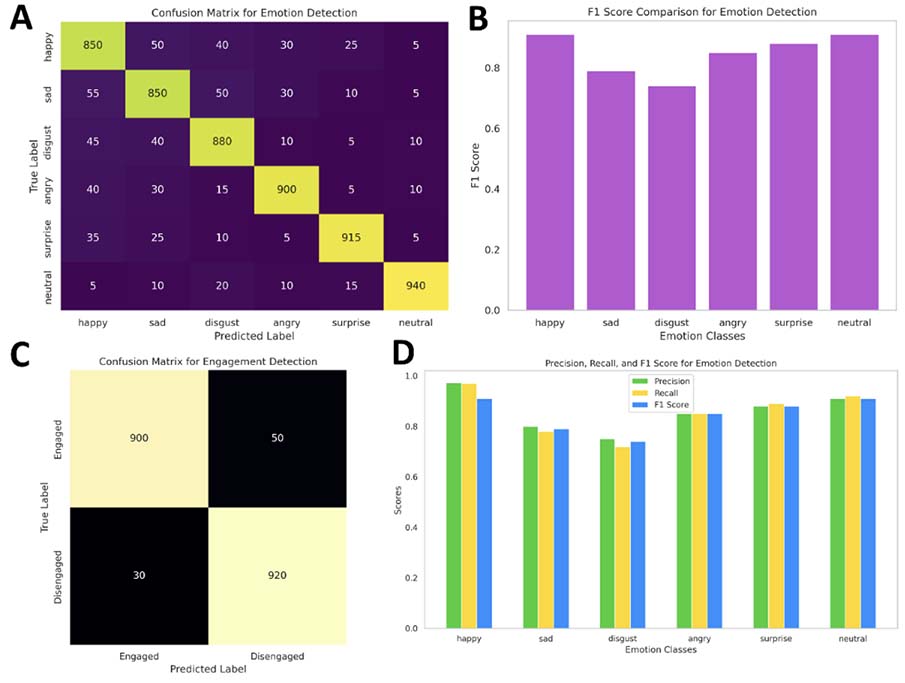
Note. (A) Confusion matrix for emotion detection. (B) F1 score comparison across emotion classes. (C) Confusion matrix for engagement detection. (D) Precision, recall, and F1 score breakdown for emotion detection, highlighting class-wise model performance variability.
Figure 9
Confusion Matrix for BERT-Based Sentiment Classification
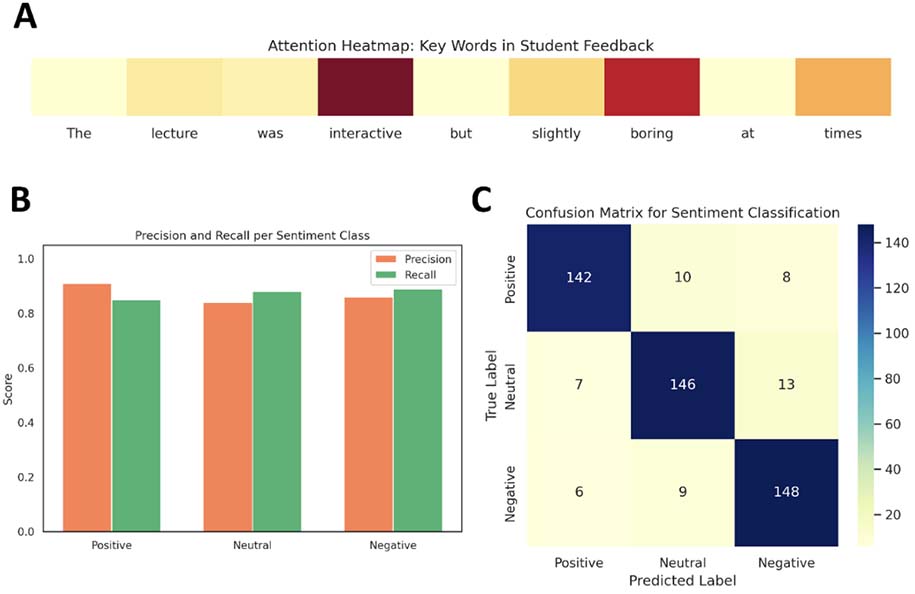
Note. Notable misclassifications are concentrated between neutral and positive categories, reflecting the interpretive subtlety of learner-generated feedback. (A) Attention heat map highlighting key tokens in student feedback. (B) Precision and recall for positive, neutral, and negative sentiment classes. (C) Confusion matrix showing sentiment classification performance across three sentiment categories with minimal interclass confusion.
The multimodal analysis, incorporating the output of both CNN-based emotion and engagement models with BERT-derived sentiment labels, resulted in the detection of unique engagement typologies. From examining 1,000 joint predictions from visual and textual data, four main clusters of behavior were found. The first cluster, consisting of students who were completely engaged, made up 34% of the group, where visual engagement was equaled by positive sentiment. The second cluster, 21% of students, was visually disengaged but showed cognitive engagement, as indicated in positive or neutral textual responses in spite of low facial attention.
The third cluster, 18% of the students, exhibited strong visual attention but negative sentiment, suggesting the lack of congruence between their facial expressions and emotional state. The last group, fully disengaged students, constituted 27% of the sample, demonstrating both low visual engagement and negative sentiment in their responses. Interestingly, more than 20% of the students belonged to the second type, “Visually Disengaged, Cognitively Engaged,” demonstrating internal motivation not reflected through outward facial displays. This was reflected through expressions including “content was great but too long” or “interested but distracted.” A rules-based matching engine was used for categorization of these behaviors based on confidence thresholds established at 85% and above.
This analysis was brought to life using Sankey diagrams and heat maps, which captured the interplay between emotion, engagement, and sentiment. Multimodal insights were fed into instructor dashboards, allowing personalized interventions based on the individualized profiles of student engagement and sentiment, facilitating better understanding and support of students in real time.
Figure 9 shows a detailed analysis of a sentiment analysis model on service-based user feedback comments. The analysis shows both the distribution and performance of predicted sentiment labels across visualizations. In Figure 10A, the violin plots outline the prediction confidence scores per sentiment class. The one-star class shows high spread with relatively high confidence, indicating the model is confident in predicting very negative sentiments. Conversely, the two-star and three-star classes show lower and more variable confidence, which can indicate uncertainty in moderately negative and neutral sentiments. Figure 10B shows a confusion matrix between actual and predicted sentiment labels. The model is extremely accurate in predicting neutral (three-star) comments, with 43 correctly predicted instances. It, however, cannot differentiate between dissatisfied (one-star) and satisfied (five-star) labels, usually misclassifying both as neutral or adjacent classes. Interestingly, only 7 out of 10 actual five-star comments were correctly predicted, with 3 wrongly predicted as four-star. Figure 10C shows the distribution of predicted sentiment labels.
Most predictions fell into the three-star category, as predicted by the model’s bias shown in the confusion matrix. This can indicate overreliance on the neutral class, perhaps due to overlapping language features between sentiment levels. Figure 10D further evidences this trend, showing the distribution of predicted sentiment by actual sentiment categories. A high proportion of actual one-star and five-star comments were mislabeled as three-star, further reinforcing the model’s tendency to resort to neutrality. Lastly, Figure 10E compares positive and negative sentiment word clouds. Positive feedback highlights words such as “help,” “wellness,” and “resources,” while negative comments highlight “counseling,” “don’t,” and “problems,” indicating dissatisfaction with service quality and access.
Figure 10
Sentiment Analysis for Students Based on Different Classes
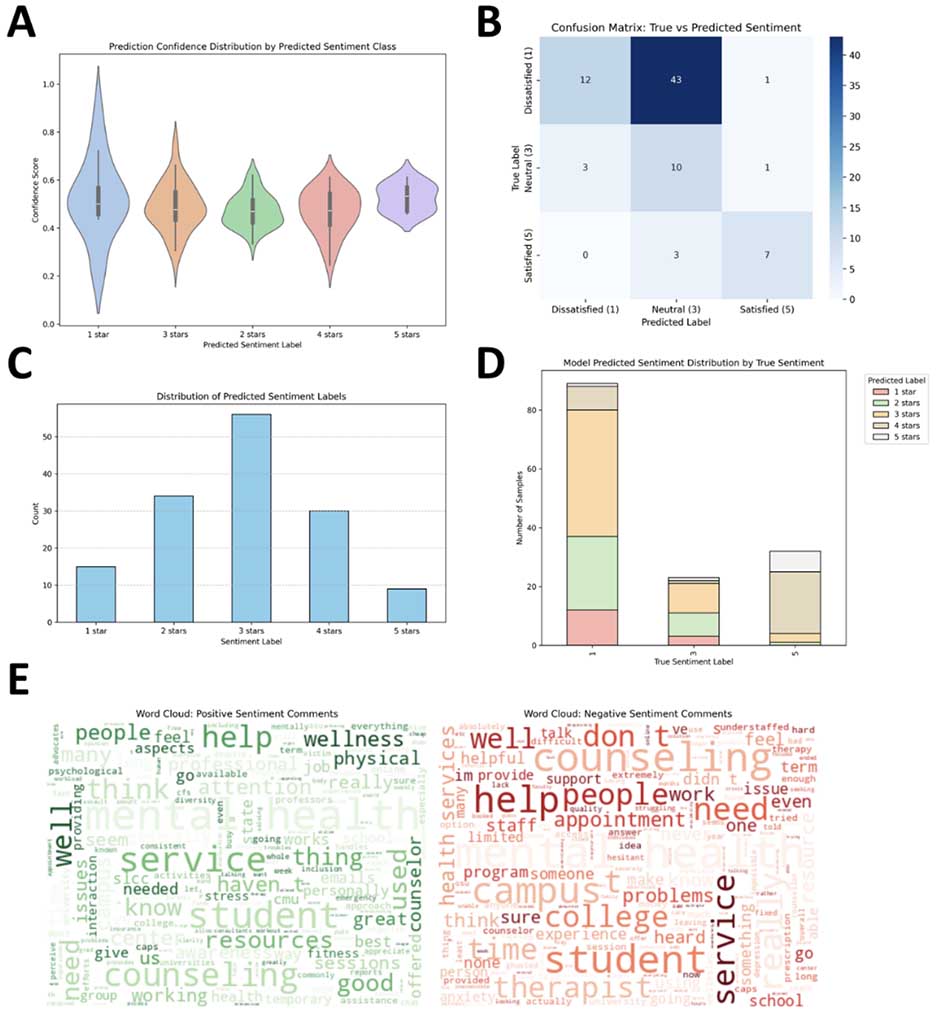
Note. (A) Confidence by sentiment class. (B) Confusion matrix of true vs. predicted labels. (C) Predicted sentiment label distribution. (D) predicted label breakdown by true sentiment. (E) Word clouds of positive (left) and negative (right) comments.
This research proposed a new multimodal approach that integrates computer vision and natural language processing methods to measure students’ emotions and engagement in online learning settings. Through the integration of facial expression recognition using convolutional neural networks (CNNs) and sentiment analysis using fine-tuned transformer models (BERT), the study sought to detect both explicit behavioral cues and underlying affective states, filling an essential gap in current learner analytics (Bar et al., 2023; Ortigosa et al., 2014). The research approach was systematically laid out, starting with the creation of two precisely constructed datasets: a 10,000-image facial emotion dataset labeled into five core emotions and a 4,000-image engagement dataset based on behavioral signals.
A concurrent textual dataset of 1,667 students’ responses across various MOOCs complemented the analysis with subjective comments. Both visual and text inputs were received thorough preprocessing to maximize model performance; data augmentation enhanced generalization in image inputs, whereas tokenization and cleaning conditioned textual responses for BERT-based classification (AlZu’bi et al., 2022; Yu & Chauhan, 2025). Both CNN architectures recorded high performance on classification, with over 92% validation accuracy in both emotion and engagement tasks. The BERT sentiment classifier recorded an F1 score of 0.87 and an accuracy of 88.1%, showing resilience in detecting contextually rich feedback. These results not only justify the design of the architecture but also fare better compared with previous unimodal work (Mandia et al., 2024). For example, previous research on facial emotion recognition in learning environments tended to report accuracies of 70%-85% in constrained environments, and sentiment analysis with traditional NLP methods usually plateaued at approximately 80% due to lack of contextual understanding (Bhardwaj et al., 2021).
The current study, on the other hand, shows that a single multimodal frame study can dramatically improve performance and fidelity of insight. A key strength was the study’s capacity to delineate four clusters of behavior via multimodal integration, ranging from fully engaged to multimodally disengaged learners. The discovery of the “visually disengaged but cognitively engaged” subgroup, representing more than 20% of the cohort, emphasizes the subtle nature of learner engagement, frequently neglected in facial-only or text-only studies (Muniasamy & Alasiry, 2020; Salau et al., 2022). Results of health education feedback sentiment analysis corroborate the accuracy of model prediction while implying the value of multimodal analysis based on tested educational theory. Of most interest, perhaps, is the implication that misclassification patterns—for example, bias in a model toward neutral prediction and lower precision in identifying strong positive or negative sentiments—are reflective of more nuanced emotional expression by students. These nuances are consonant with constructs of the Community of Inquiry (CoI) model during the triggering event and exploration states of cognitive presence, when students can be deeply engaged without much manifest affect.
From the perspective of cognitive load theory (CLT), this subdued affective expression can also be due to excessive extraneous load, which can cause learners to favor cognitive processing over expression behavior. Furthermore, the patterns can indicate self-regulated learning (SRL) strategies such as emotion suppression or cognitive rehearsal, which are particularly common in health science education contexts, including when emotionally loaded or ethically sensitive content is present. The typologies of engagement discovered—for example, students who responded with neutral facial expressions but provided cognitively rich textual feedback—also attest to the ways in which latent engagement can be articulated. These trends also signal the shortcomings of unimodal analysis and the advantages of multimodal analysis in recognizing latent engagement.
Integrating AI-facilitated engagement typologies with pedagogical theory has deep implications for educational design. Affective and cognitive cues inferred from multimodal analytics must not be considered technical outputs but rather as pedagogical readiness and psychological need indicators. For instance, students with visual disengagement but high sentiment-based engagement might be using adaptive coping strategies as an adaptive response to emotionally demanding content. Such information allows for the creation of emotionally aware dashboards, intervention procedures, and adaptive instruction tactics attuned to the subtle needs of health science education. This highlights the need for multimodal analysis within education technology in line with more recent calls across affective computing and learning analytics literature for holistic, context-aware models.
At a scientific level, this advances the field across three main areas (Jakkaladiki et al., 2023; Sebbaq & El Faddouli, 2022). First, it shows that CNN and transformer models can be co-deployed in parallel pipelines for real-time, scalable learning analytics. Second, it provides an exportable, generalizable pipeline that can be used in a wide range of educational settings with the assistance of exportable model formats and included metadata. Third, it provides empirical support for the association between textual sentiment and visual indicators of engagement, though small (r = 0.31), which justifies further research in adaptive learning settings.
The implications for the educational and scientific communities are significant (Kirsal Ever & Dimililer, 2018). For teachers, the system provides an early warning system in dashboard form so that they can intervene in pedagogy on time. For researchers, it provides avenues for studying cognitive-affective modelling, discovery of student typology, and cross-modal reinforcement learning.
The approach also has wider potential applications outside of education, for instance, in telehealth, user experience studies, and human-computer interaction, where emotion-aware systems can enable effective personalization. In short, this research makes a major leap in multimodal learning analytics by bringing together vision and language models to provide real-time, interpretable, and high-performing understanding of student behavior (Murshed et al., 2019). Its rigor of method, comparative superiority to existing methodologies, and actionable results make it a foundational study with far-reaching implications for the intelligent education system of the future.
This research offers a holistic multimodal approach to identifying and interpreting student emotions and engagement in online learning environments through the use of deep learning and natural language processing. The combination of facial expression analysis and sentiment classification offers a more nuanced, multidimensional view of learner behavior. By building balanced, high-quality datasets that include facial imagery and MOOC-based student feedback, the research ensured representational integrity and methodological robustness. Preprocessing methods for images and class-balancing techniques enabled peak model performance, and data augmentation provided essential variability, boosting generalization.
The CNN-based classifiers of emotion and engagement performed robust validation accuracies in excess of 92%, with consistent identification of such salient features as gaze direction and mouth curvature. In parallel, the fine-tuned sentiment model of BERT reached 88.1% accuracy in correctly identifying primary linguistic markers of student sentiment. Multimodal fusion, implemented through a rules-based engine, facilitated the identification of finer-grained behavioral typologies such as “cognitively engaged but visually disengaged” students, capturing internal engagement in the face of outward distraction. Interestingly, the combined analysis showed a 20% rate of visually disengaged students who gave positive feedback, highlighting the inadequacy of unimodal analysis in representing the entire range of learner experiences.
These results justify the effectiveness of a multimodal approach to educational analytics and recommend its incorporation into instructor-facing dashboards for targeted interventions. This work illustrates the power of combining multimodal engagement detection with pedagogical theory to enhance adaptive online learning environments. The framework introduced here allows the detection of latent states of engagement, most notably when cognitive effort cannot be observed externally. With the addition of emotion recognition and sentiment analysis, instructors are able to understand learner experience from a more comprehensive perspective and adjust instruction accordingly. In practical terms, the framework offers direct application within intelligent tutoring systems, learning management systems, and virtual classroom environments.
These tools can support real-time feedback loops, alert mechanisms for disengagement, and dynamic instructional pacing based on affective and cognitive cues. In general, the study emphasizes the need to balance technological sophistication with pedagogical understanding, providing a scalable solution for real-time monitoring and support of student activity. The exportability and high generalizability of the models make them strong candidates to be part of future intelligent tutoring systems, setting the stage for adaptive e-learning environments that are both emotionally and contextually sensitive.
ChatGPT said: The multimodal sentiment and engagement typologies developed in this study offer valuable insights for instructional design and intervention strategies, particularly in emotionally and cognitively demanding domains such as health education. Integrating affective signals with validated learner feedback enables a deeper understanding of learner states beyond superficial engagement metrics. For instance, visually disengaged but cognitively engaged learners (Cluster 2) may exhibit high intrinsic motivation or cognitive load management, requiring reflective activities, personalized feedback, and subtle check-ins to sustain cognitive presence. In contrast, learners who are both visually and cognitively disengaged (Cluster 4) face higher attrition risks; early warning systems with automated nudges or targeted scaffolds can restore focus and prevent decline. Systemically, this typology supports adaptive dashboards integrating multimodal analytics to visualize emotional tone, sentiment shifts, and engagement depth—empowering educators in health education to make data-informed, pedagogically sound decisions that enhance learner resilience, engagement, and well-being.
Although the intended multimodal approach reveals encouraging performance in emotion and engagement prediction, various limitations affect the generalizability of the findings. The dataset used in this work mostly represents English-speaking, computer-literate university students in countries with established Internet infrastructure and previous experience in online learning environments. This homogeneity in terms of population risks generating possible biases and limits the generalizability of the findings to linguistically heterogeneous or resource-poor groups. Besides, cultural influences on expressing emotions can degrade the performance of visual engagement detection systems. Students from collectivist cultures, for example, tend to present more subdued facial expressions, which can contribute to underestimation of their engagement levels. Such cultural factors make it difficult to generalize emotion-based detection models to diverse populations of learners. To counter these issues, future studies must include fairness-aware training procedures and attempt to diversify data by sampling participants from varied geographical, linguistic, and cultural backgrounds. These considerations are crucial to create fair and context-sensitive learning technologies.
Alruwais, N. M., & Zakariah, M. (2024). Student recognition and activity monitoring in e-classes using deep learning in higher education. IEEE Access, 12, 66110-66128. https://doi.org/10.1109/ACCESS.2024.3354981
AlZu’bi, S., Abu Zitar, R., Hawashin, B., Abu Shanab, S., Zraiqat, A., Mughaid, A., Almotairi, K. H., & Abualigah, L. (2022). A novel deep learning technique for detecting emotional impact in online education. Electronics, 11(18), Article 2964. https://doi.org/10.3390/electronics11182964
Bar, T., Dutta, D. K., Kumar, A., Tiwari, A., Maity, S., & Sau, S. (2023). A deep learning-based approach for students’ involvement assessment in an e-learning platform. In 2023 International Conference in Advances in Power, Signal, and Information Technology (APSIT) (pp. 426-431). IEEE. https://doi.org/10.1109/APSIT58554.2023.10201682
Bhardwaj, P., Gupta, P., Panwar, H., Siddiqui, M. K., Morales-Menendez, R., & Bhaik, A. (2021). Application of deep learning on student engagement in e-learning environments. Computers & Electrical Engineering, 93, Article 107277. https://doi.org/10.1016/j.compeleceng.2021.107277
Chelloug, S. A., Ashfaq, H., Alsuhibany, S. A., Shorfuzzaman, M., Alsufyani, A., & Jalal, A. (2023). Real objects understanding using 3D haptic virtual reality for e-learning education. Computers, Materials & Continua, 75(1), 1607-1624. https://doi.org/10.32604/cmc.2023.032245
Dewan, M. A. A., Lin, F., Wen, D., Murshed, M., & Uddin, Z. (2018). A deep learning approach to detecting engagement of online learners. In 2018 IEEE SmartWorld, Ubiquitous Intelligence & Computing, Advanced & Trusted Computing, Scalable Computing & Communications, Cloud & Big Data Computing, Internet of People and Smart City Innovation (SmartWorld/SCALCOM/UIC/ATC/CBDCom/IOP/SCI) (pp. 1895-1902). https://doi.org/10.1109/SmartWorld.2018.00318
Ezaldeen, H., Misra, R., Bisoy, S. K., Alatrash, R., & Priyadarshini, R. (2022). A hybrid e-learning recommendation integrating adaptive profiling and sentiment analysis. Journal of Web Semantics, 72, Article 100700. https://doi.org/10.1016/j.websem.2021.100700
Gambo, F., Wajiga, G. M., Shuib, L., Garba, E. J., Abdullahi, A. A., & Bisandu, D. B. (2022). Performance comparison of convolutional and multiclass neural network for learning style detection from facial images. EAI Endorsed Transactions on Scalable Information Systems, 9(35), Article e1. https://doi.org/10.4108/eai.20-10-2021.171549
Garrison, D. R., Anderson, T., & Archer, W. (2010). The first decade of the community of inquiry framework: A retrospective. The Internet and Higher Education, 13(1-2), 5-9. https://doi.org/10.1016/j.iheduc.2009.10.003
Jakkaladiki, S. P., Janečková, M., Krunčík, J., Malý, F., & Otčenášková, T. (2023). Deep learning-based education decision support system for student e-learning performance prediction. Scalable Computing: Practice and Experience, 24(3), 327-338. https://doi.org/10.12694/scpe.v24i3.2188
Khan, F. M., Iqbal, Z., Akhtar, M. S., & Khan, I. U. (2024). Machine learning-based students’ sentiment towards e-learning amid COVID-19 pandemic. The Asian Bulletin of Big Data Management, 4(1), 1-20. https://doi.org/10.62019/abbdm.v4i1.132
Kirsal Ever, Y., & Dimililer, K. (2018). The effectiveness of a new classification system in higher education as a new e-learning tool. Quality & Quantity, 52 (Suppl 1), 573-582. https://doi.org/10.1007/s11135-017-0636-y
Liu, Y., Chen, W., & Zhang, H. (2024). Deep multimodal fusion for affective learning analytics: Integrating facial and textual data for engagement prediction. IEEE Transactions on Learning Technologies, 17(2), 214-229. https://doi.org/10.1109/TLT.2024.3352149
Mandia, S., Mitharwal, R., & Singh, K. (2024). Automatic student engagement measurement using machine learning techniques: A literature study of data and methods. Multimedia Tools and Applications, 83(16), 49641-49672. https://doi.org/10.1007/s11042-023-17534-9
Muniasamy, A., & Alasiry, A. (2020). Deep learning: The impact on future eLearning. International Journal of Emerging Technologies in Learning (iJET), 15(1), 188-199. https://doi.org/10.3991/ijet.v15i01.11435
Murshed, M., Dewan, M. A. A., Lin, F., & Wen, D. (2019). Engagement detection in e-learning environments using convolutional neural networks. In 2019 IEEE Intl Conf on Dependable, Autonomic and Secure Computing, Intl Conf on Pervasive Intelligence and Computing, Intl Conf on Cloud and Big Data Computing, Intl Conf on Cyber Science and Technology Congress (DASC/PiCom/CBDCom/CyberSciTech) (pp. 80-86). IEEE. https://doi.org/10.1109/DASC/PiCom/CBDCom/CyberSciTech.2019.00028
Ortigosa, A., Martín, J. M., & Carro, R. M. (2014). Sentiment analysis in Facebook and its application to e-learning. Computers in Human Behavior, 31, 527-541. https://doi.org/10.1016/j.chb.2013.05.024
Pathak, D., & Kashyap, R. (2023). Neural correlate-based e-learning validation and classification using convolutional and long short-term memory networks. Traitement du Signal, 40(4), 1457-1467. https://doi.org/10.18280/ts.400414
Picard, R. W. (2010). Affective computing: From laughter to IEEE. IEEE Transactions on Affective Computing, 1(1), 11-17. https://doi.org/10.1109/T-AFFC.2010.10
Salau, L., Hamada, M., Prasad, R., Hassan, M., Mahendran, A., & Watanobe, Y. (2022). State-of-the-art survey on deep learning-based recommender systems for e-learning. Applied Sciences, 12(23), Article 11996. https://doi.org/10.3390/app122311996
Sebbaq, H., & El Faddouli, N.-e. (2022). Fine-tuned BERT model for large scale and cognitive classification of MOOCs. International Review of Research in Open and Distributed Learning, 23(2), 170-190. https://doi.org/10.19173/irrodl.v23i2.6023
Selim, T., Elkabani, I., & Abdou, M. A. (2022). Students engagement level detection in online e-learning using hybrid EfficientNetB7 together with CN, LSTM, and Bi-LSTM. IEEE Access, 10, 99573-99583. https://doi.org/10.1109/ACCESS.2022.3206779
Sweller, J. (2019). Cognitive load theory and educational design: Recent developments. Educational Psychology Review, 31(2), 261-276. https://doi.org/10.1007/s10648-019-09465-5
Toti, D., Capuano, N., Campos, F., Dantas, M., Neves, F., & Caballé, S. (2021). Detection of student engagement in e-learning systems based on semantic analysis and machine learning. In Advances on P2P, Parallel, Grid, Cloud and Internet Computing: Proceedings of the 15th International Conference on P2P, Parallel, Grid, Cloud and Internet Computing (3PGCIC-2020) 15 (pp. 211-223). Springer International Publishing. https://doi.org/10.1007/978-3-030-61105-7_21
Yin, L., Zhang, X., & Luo, Z. (2023). Affective computing in online learning: Trends, challenges, and future directions. Computers in Human Behavior Reports, 11, Article 100297. https://doi.org/10.1016/j.chbr.2023.100297
Yu, J. H., & Chauhan, D. (2025). Trends in NLP for personalized learning: LDA and sentiment analysis insights. Education and Information Technologies, 30(4), 4307-4348. https://doi.org/10.1007/s10639-024-12988-2
Zhang, Y., Wang, C., & Lee, H. (2023). Text sentiment analysis using BERT for student feedback interpretation in online learning platforms. Education and Information Technologies, 28(5), 6327-6342. https://doi.org/10.1007/s10639-023-11478-z
Zimmerman, B. J. (2020). Self-regulated learning and academic achievement: An overview. Educational Psychologist, 55(3), 145-160. https://doi.org/10.1080/00461520.2020.1772025

Multimodal Engagement and Sentiment Analytics in Health Science Education: A Learning Analytics Framework Integrating AI and Pedagogical Theory by Hao Fang, Aiwei Mu, Guosheng Xing, Xingyu Chen, and Seng Yue Wong is licensed under a Creative Commons Attribution 4.0 International License.