Volume 26, Number 2
Carlos J. Torres-Vergara1, Víctor G. Alfaro-García1, José M. Merigó2, Amara Atif2, and Rory McGreal3
1Faculty of Accounting and Administrative Sciences, Michioacana University of San Nicolas of Hidalgo, Gral. Francisco J. Mugica s/n, 58030, Morelia, Michoacan, Mexico; 2School of Computer Science, Faculty of Engineering and Information Technology, University of Technology Sydney, 81 Broadway, Ultimo 2007, NSW, Australia; 3Centre for Interdisciplinary Studies, Athabasca University, Alberta, Canada
The International Review of Research in Open and Distributed Learning (IRRODL) published its first issue in 2000. This paper provides an overview of the journal’s development over its 25-year history using bibliometric indicators. We analyzed IRRODL’s performance relative to other journals in the field and have highlighted key contributing countries, institutions, and authors based on the Scopus database. Our approach used various bibliometric techniques, including the number of articles and citations, cites per paper, and the h-index. The findings reveal that IRRODL is a leading journal in open and distributed learning, attracting a diverse group of authors from institutions and countries worldwide. Currently, Athabasca University is by far the most productive university, and the United States and Canada are the most productive countries appearing in the journal. However, the journal is very diverse with publications from all over the world.
Keywords: bibliometrics, Scopus, open and distributed learning, Web of Science
The International Review of Research in Open and Distributed Learning (IRRODL) is a leading international journal in the field of open and distributed learning. Over the past 25 years, IRRODL has adapted to the evolving educational landscape and has played a central role in advancing the discussion around digital education, online pedagogies, and the use of technology in learning environments. With a CiteScore of 5.8 and an h-index of 95 in 2024, the journal maintains a strong academic presence globally.
In 2025, IRRODL celebrates its 25th anniversary (Anderson et al., 2025). It is common in academic literature for journals to commemorate significant anniversaries through various special activities (see Arrow et al., 2011; Monastersky & Van Noorden, 2019). Many journals mark these milestones by publishing special anniversary issues; for example, the Journal of Management Learning (Durepos et al., 2020) or the British Journal of Educational Administration Quarterly (Hallinger, 2023). Others publish dedicated editorials or thematic reviews. These studies offer a comprehensive overview of the research output, providing a broad retrospective of trends and influences within the journal (Figuerola-Wischke et al., 2024).
Motivated by this 25th anniversary, this article presents a bibliometric overview exploring the journal’s growth in terms of publication output to offer a comprehensive view of its global academic influence. Bibliometric analyses provide valuable insights into the development and influence of academic fields by quantifying the scholarly output and impact of journals and articles (Hussain et al., 2025). This bibliometric analysis aimed to assess the impact and scholarly contribution of IRRODL since its inception, focusing on key metrics such as citation and publication patterns, and the most productive authors, universities, and countries.
To do so, we collected all documents published in the journal between 2000 and 2023 using the Scopus database and analyzed the bibliographic information using a wide range of bibliometric indicators (Hussain et al., 2025). Understanding these dynamics is crucial for contextualizing the journal’s contributions to the field of open and distributed learning.
The rest of the paper is organized as follows. The Methods section briefly reviews the bibliometric methodology used in this paper. The Results section presents our findings, including the publication and citation structure, the most cited papers, and the leading authors, institutions, and countries publishing in the journal. The concluding section summarizes the main findings and reviews the journal’s present status.
This study used several bibliometric techniques to analyze the scholarly contribution of IRRODL over its 25-year history. Bibliometrics is the quantitative study of scholarly publications, offering a systematic method to evaluate research trends, academic productivity, and overall influence within a field (Broadus, 1987). Bibliometrics is one of the most widely employed quantitative methods used to thoroughly analyze and explain the movement and interaction of knowledge (Donthu et al., 2021).
The earliest bibliometric analysis can be traced back to the late 19th century, although for centuries there have been studies on bibliography statistics (Cole & Eales, 1917). Although the study did not incorporate citation analysis, it is still considered the first example of a bibliometric study. During the 20th century, the pioneering works of Eugene Garfield and other authors consolidated the field (Bensman, 2007; Garfield, 1955). Nowadays, the effectiveness of modern bibliometrics has significantly improved with the advent of comprehensive databases such as Scopus and Web of Science. Although the term bibliometrics was first used by Paul Otlet in 1934 (Rousseau, 2014), the modern definition was coined by Alan Pritchard in 1969 (Pritchard, 1969).
Bibliometrics can be applied to analyze a variety of academic subjects, such as a journal (Chen et al., 2020; Rialp et al., 2019), a topic (Rojas-Sánchez et al., 2023), or a country (Merigó et al., 2016). This methodology is widely used across fields, including economics, environmental sciences, and educational research. In education, for example, bibliometric studies have highlighted leading authors, institutions, and countries contributing to open and distance learning (Cheng et al., 2014; Durak et al., 2024; Rojas-Sánchez et al., 2023). Many journals have published a bibliometric overview of their publications, including the Journal of Computer Assisted Learning (Akturk, 2022), IEEE Transactions on Learning Technologies (Zurita et al., 2022), Journal of Research on Technology in Education (Wilson, 2022), and the British Journal of Educational Technology (Chen et al., 2020).
This study used data from Scopus, which is managed by Elsevier. Scopus contains a vast array of scholarly content, including over 1.7 billion cited references from more than 90.6 million records, and it covers approximately 27,950 active titles across various disciplines (Scopus, 2024). Other databases, including Google Scholar, Web of Science (WoS), and Microsoft Academic could also be considered (Bar-Ilan, 2008). However, Google Scholar and Microsoft Academic, although comprehensive, have several limitations in their search functionalities. These include limited support for Boolean and advanced search operators, restricted filtering options, and non-transparent algorithms for query processing and document ranking, which make them less suitable for rigorous bibliometric analysis. In this study, Scopus was selected due to its extensive coverage of peer-reviewed content, providing a comprehensive and representative view of global research, and because it is often preferred over other databases in bibliometric studies for its broader scope and more detailed citation data (Ding et al., 2014; Glanzel et al., 2019).
The data for this study was collected from the Scopus database between July and September 2024, using the query “International Review of Research in Open and Distributed Learning” OR “International Review of Research in Open and Distance Learning” (the former title) in the “Source Title” option, excluding documents from 2024 as the year was not finished. This resulted in a total of 1,247 documents, covering articles, reviews, and conference papers from 2000 to 2023. The advanced search for the replicability of this procedure is: SOURCE-ID (17781) AND PUBYEAR > 1999 AND PUBYEAR < 2024 AND (LIMIT-TO (DOCTYPE, "ar") OR LIMIT-TO (DOCTYPE, "re") OR LIMIT-TO (DOCTYPE, "cp").
To properly evaluate a bibliometric study, it is essential to define the specific bibliometric indicators used in the analysis. The most frequently employed indicators are the total number of publications and the total number of citations, both of which are generally seen as reliable measures of productivity and impact (Podsakoff et al., 2008). However, it is important to acknowledge that these indicators offer only a broad understanding and may not always perfectly capture productivity or influence. Co-authorship, for example, can affect productivity measures, as papers authored by individuals alone may show lower productivity, while some authors who did not contribute as much to the paper are still considered.
Other commonly used bibliometric indicators include the average citations per paper, the h-index, and citation thresholds (Hussain et al., 2025). The h-index is a measure that aims to represent the importance of a set of papers defining the largest number of H for which an author has H papers with at least H citations each (Hirsch, 2005). The h-index, which combines measures of both productivity and influence, has been extended and generalized by many authors. It is considered a good method by which to evaluate the influence of an author or journal because it combines different metrics in one indicator (Alonso et al., 2009). However, it has some weaknesses in measuring and analyzing very highly cited papers, but it works quite well with huge volumes of publications (Alonso et al., 2009).
Citation thresholds are used to count the number of publications that have surpassed a specific citation level, such as 10 or 100 citations. This is one of the most used metrics for bibliometric analysis and one of the main indicators used in this document. We sought to provide a comprehensive evaluation of bibliographic data by using multiple indicators for the same variable. This approach is justified by the absence of a universally accepted method for evaluating research. In practice, the evaluation strategy must be tailored to the specific problem being studied, as the relative importance of productivity and influence can vary. In some cases, their correlation may shift, either increasing or decreasing, depending on the context.
By applying these bibliometric techniques, this study offers a comprehensive evaluation of IRRODL’s academic impact, contributing to a deeper understanding of the journal’s role in shaping research in open and distributed learning.
This section presents the results of our analysis. Between 2000 and 2023, IRRODL published 1,247 documents, when considering solely articles, reviews, letters, and notes. As of August 2024, the journal has 42,505 citations, and the h-index is 95.
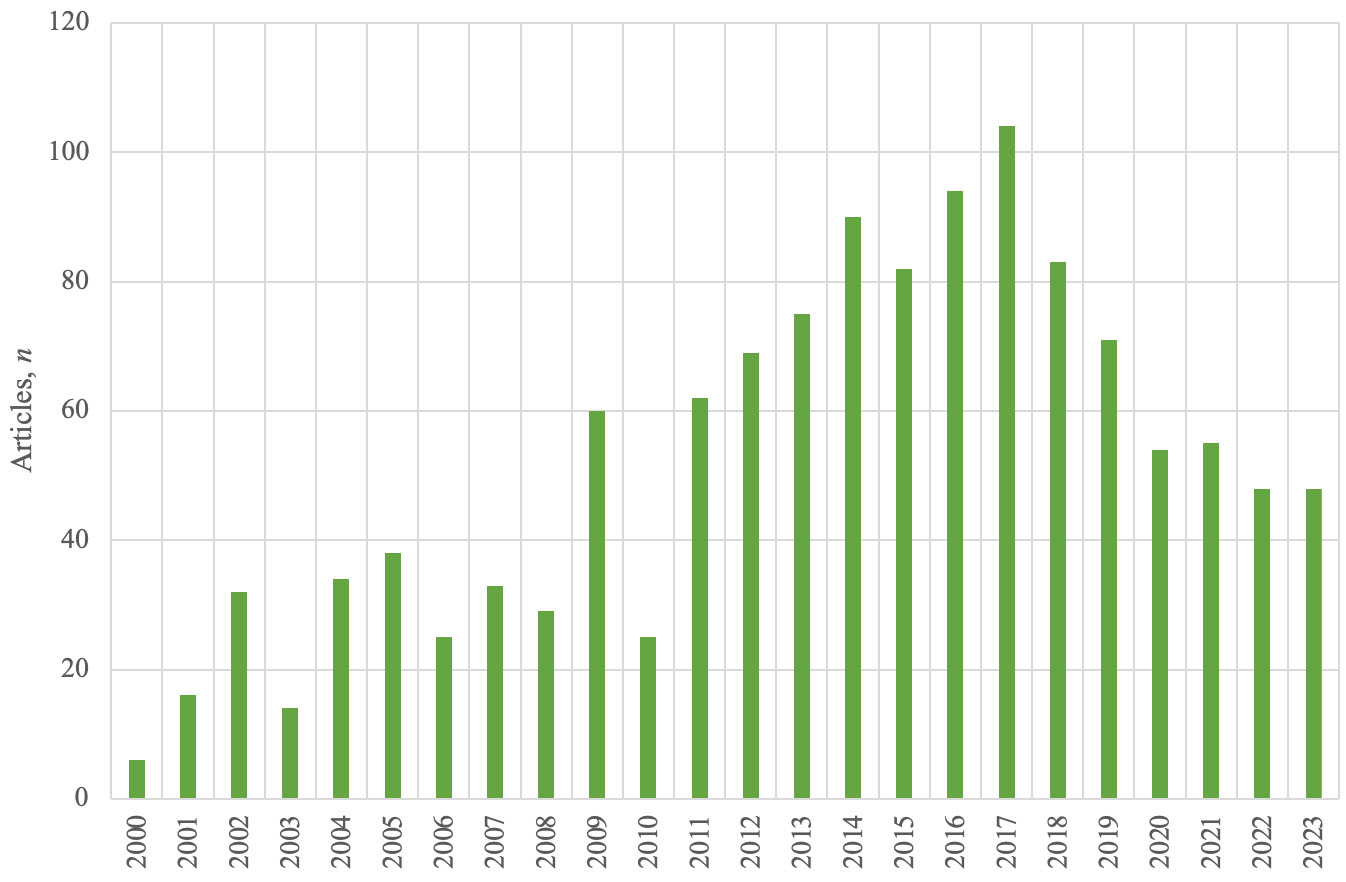
Figure 1 illustrates the annual number of papers published by IRRODL from 2000 to 2023. Up to 2018, the journal saw a steady increase in its publication output, reflecting its growing influence and recognition within the field of open and distributed learning. In 2018, the editorial team made a decision to limit the number of publications to 40 research articles per year. This policy remains in place.
Figure 1
Annual Number of Papers Published in IRRODL
During its initial years (2000–2004), IRRODL published a modest number of articles, starting with just 6 papers in 2000 and reaching 38 papers by 2005. This early period marks the foundation of the journal as it began to establish itself in the academic community.
From 2010 onwards, there was a steady and significant rise in publication numbers, peaking at 104 papers in 2017. This surge correlates with the broader growth of open education resources and online learning, topics central to IRRODL’s scope. Following this peak, the new policy to reduce the number of published research articles to 40 was implemented.
The box-plot structure in Figure 2 provides a visual representation of the annual distribution of citations received by papers published in IRRODL. Each box plot summarizes the spread of citations for each publication year, offering insights into the median, quartiles, and outliers within the citation patterns (Hussain et al., 2025; Tukey, 1977). Note that the figure is adjusted to 300 citations so outliers with fewer than 300 citations appear in orange, while extreme outliers with more than 300 citations are depicted in blue.
Figure 2
Annual Box-Plot Structure of the Citations of all Papers Published in IRRODL
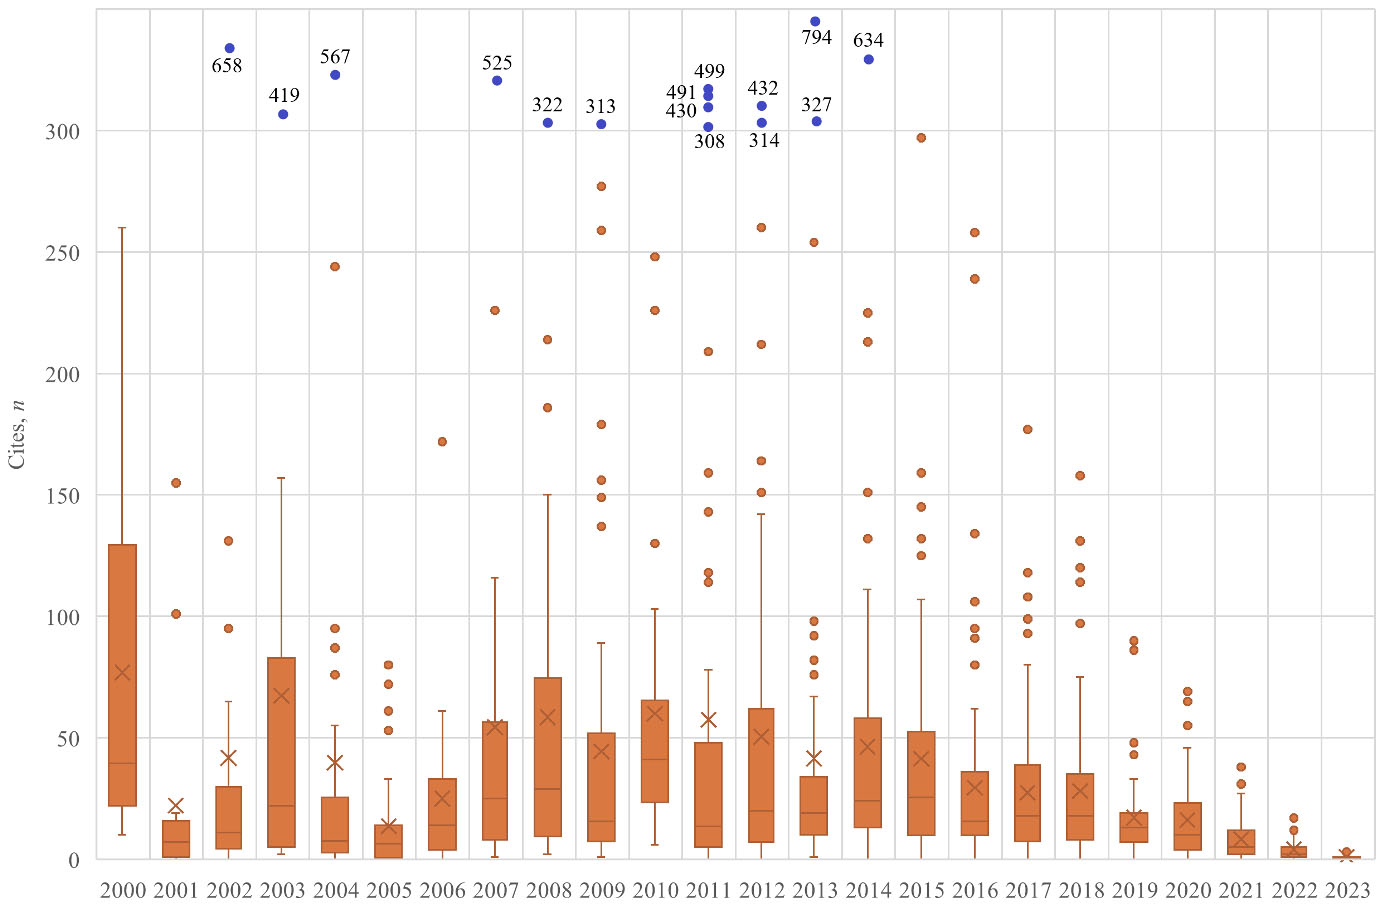
Note. Articles with fewer than 300 citations appear in orange. Articles with more than 300 citations appear in blue.
The central trend observed across the years is a general increase in the median number of citations per article, reflecting the growing influence and visibility of the journal. The upper quartiles in most years indicate a significant number of highly cited papers, with some extreme outliers, representing exceptional research that has had a considerable impact on the field of open and distributed learning.
Notably, the years 2011, 2014, and 2017 show particularly high variability, with several papers achieving a citation count far above the median, highlighting the presence of a few standout articles that garnered substantial attention from the academic community. Conversely, the box plots for the years 2019–2023 show narrower ranges. However, this is expected due to their relative recency.
Table 1 presents a detailed analysis of IRRODL’s performance in the Journal Citation Reports (JCR) of the Web of Science (WoS; Clarivate, 2024) and Scopus (Scopus, 2024).
Table 1
Analysis of IRRODL in the JCRs of the WoS and Scopus
| Year | TC | IF | 5YIF | ImIn | CI | AIS | REER | Q | PEER | CS | PS | QS |
| 2011 | 228 | 0.68 | - | 0.14 | 63 | - | 108/206 | Q3 | 47.82 | 1.6 | 73 | Q2 |
| 2012 | 308 | 0.60 | - | 0.13 | 68 | - | 114/219 | Q3 | 48.17 | 1.8 | 77 | Q1 |
| 2013 | 349 | 0.74 | - | 0.04 | 75 | - | 108/219 | Q2 | 50.91 | 2.3 | 83 | Q1 |
| 2014 | 466 | 0.73 | 1.00 | 0.04 | 73 | 0.27 | 116/224 | Q3 | 48.44 | 3.0 | 90 | Q1 |
| 2015 | 725 | 1.24 | 1.44 | 0.19 | 47 | 0.32 | 61/231 | Q2 | 73.81 | 3.5 | 90 | Q1 |
| 2016 | 1,273 | 1.73 | 2.13 | 0.16 | 92 | 0.33 | 47/235 | Q1 | 80.21 | 4.0 | 90 | Q1 |
| 2017 | 1,899 | 1.82 | 2.60 | 0.18 | 85 | 0.35 | 70/239 | Q2 | 70.92 | 4.3 | 93 | Q1 |
| 2018 | 2,188 | 1.83 | 2.70 | 0.15 | 80 | 0.32 | 83/243 | Q2 | 66.05 | 4.2 | 93 | Q1 |
| 2019 | 2,443 | 2.29 | 2.88 | 0.32 | 70 | 0.36 | 59/263 | Q1 | 77.76 | 4.2 | 93 | Q1 |
| 2020 | 3,340 | 2.74 | 3.52 | 0.57 | 52 | 0.89 | 97/265 | Q2 | 63.58 | 5.8 | 95 | Q1 |
| 2021 | 3,489 | 2.77 | 3.48 | 0.52 | 51 | 0.78 | 105/270 | Q2 | 61.3 | 6.1 | 94 | Q1 |
| 2022 | 3,610 | 3.4 | 3.7 | 0.5 | 45 | 0.76 | 73/269 | Q2 | 73 | 5.6 | 89 | Q1 |
| 2023 | 3,040 | 2.5 | 3.4 | 0.3 | 48 | 0.72 | 133/760 | Q1 | 82.6 | 5.8 | 86 | Q1 |
Note. JCR = journal citation report; WoS = Web of Science; TC = total citations; IF = impact factor; 5YIF = 5-year impact factor; ImIn = immediacy index; CI = citable items; AIS = article influence score; REER = ranking in the WoS category of education and educational research; Q = quartile in education and educational research; PEER = journal impact factor percentile in education and educational research; CS = CiteScore of Scopus; PS = percentile in Scopus; QS = quartile in Scopus.
The data demonstrates IRRODL’s steady rise in prominence within its field, particularly in the categories of “education and educational research” and “communication.” Since its inclusion in the JCRs in 2011, IRRODL has seen a continuous improvement in its impact factor, reflecting its growing influence and the increasing quality of research it publishes. By 2016, the journal’s impact factor exceeded 1.7, positioning it among the top quartile in its category. Since then, the journal has been fluctuating between the first and second quartiles (Q1 and Q2). Note that in Scopus, since 2012, IRRODL has always been ranked in the first quartile (Q1).
The 5-year impact factor also provides a broader perspective of the journal’s sustained impact over time, showing consistent growth that mirrors global trends in open and distributed learning research. Note that the 5-year impact factor and the article influence score (Bergstrom et al., 2008) require six years before they can be calculated instead of the three years of the impact factor. This is the reason why there are no results between 2011 and 2013 for these two indicators. The table reveals that in recent years, IRRODL has maintained a strong citation base, indicating that its publications continue to be highly relevant and frequently referenced in ongoing research.
Table 2 highlights the publication records of the leading journals in the field of educational research, ranked by the C10 index (the number of citations received by the papers published between 2014 and 2023). This metric provides a clear indication of both the productivity and impact of these journals within the academic community, serving as a reliable measure of long-term influence. IRRODL is consistently positioned among the top-tier journals in educational research, demonstrating strong performance in terms of both the number of published papers and the number of highly cited articles.
Table 2
Publication Record of Leading Journals Connected to IRRODL (Rank by C10)
| Journal name | P10 | C10 | C/P10 | H10 | TP | TC | C/P | H | Articles, n | |
| ≥ 500 citations | ≥ 100 citations | |||||||||
| IRRODL | 729 | 18,741 | 25.71 | 66 | 1,247 | 42,505 | 34.09 | 95 | 7 | 88 |
| Computers & Education | 1,948 | 126,570 | 64.97 | 161 | 5,096 | 323,194 | 63.42 | 243 | 61 | 874 |
| Review of Educational Research | 697 | 51,356 | 73.68 | 123 | 3,984 | 276,367 | 69.37 | 260 | 118 | 640 |
| British Journal of Educational Technology | 1,187 | 39,968 | 33.67 | 89 | 3,085 | 96,844 | 31.39 | 123 | 5 | 188 |
| Journal of Educational Psychology | 866 | 35,106 | 40.54 | 90 | 7,983 | 425,570 | 53.31 | 299 | 124 | 1,041 |
| Interactive Learning Environments | 1,578 | 28,648 | 18.15 | 69 | 1,870 | 36,842 | 19.70 | 77 | 1 | 46 |
| Educational Technology Research and Development | 960 | 22,624 | 23.57 | 68 | 1,934 | 76,278 | 39.44 | 119 | 16 | 157 |
| Educational Technology & Society | 716 | 22,356 | 31.22 | 69 | 1,988 | 68,747 | 34.58 | 114 | 5 | 136 |
| Educational Researcher | 569 | 21,180 | 37.22 | 76 | 2,150 | 170,268 | 79.19 | 189 | 67 | 346 |
| The Internet and Higher Education | 274 | 19,970 | 72.88 | 77 | 702 | 63,817 | 90.91 | 122 | 19 | 159 |
| Journal of Computer Assisted Learning | 788 | 19,115 | 24.26 | 62 | 1,984 | 63,354 | 31.93 | 118 | 4 | 150 |
| Journal of Educational Computing Research | 591 | 12,782 | 21.63 | 53 | 1,368 | 36,591 | 26.75 | 82 | 3 | 53 |
| Australasian Journal of Educational Technology | 618 | 11,916 | 19.28 | 55 | 1,064 | 26,303 | 24.72 | 72 | 2 | 36 |
| Distance Education | 334 | 8,127 | 24.33 | 48 | 1,101 | 24,205 | 21.98 | 73 | 2 | 46 |
| American Journal of Distance Education | 287 | 3,588 | 12.50 | 29 | 652 | 11,016 | 16.90 | 47 | 4 | 11 |
| Open Learning | 236 | 2,633 | 11.16 | 27 | 1,004 | 9,809 | 9.77 | 44 | 0 | 11 |
| International Journal of Distance Education Technologies | 187 | 1,948 | 10.41 | 21 | 411 | 3,321 | 8.08 | 23 | 0 | 2 |
| Journal of Asynchronous Learning Networks | 84 | 1,829 | 21.77 | 24 | 369 | 14,298 | 38.75 | 56 | 3 | 33 |
| Journal of Interactive Media in Education | 101 | 1,131 | 11.20 | 18 | 101 | 1,131 | 11.20 | 18 | 0 | 1 |
| Open Praxis | 111 | 487 | 4.39 | 11 | 111 | 487 | 4.39 | 11 | 0 | 0 |
Note. P10 = publications; C10 = citations; C/P10 = citations per paper; H10 = h-index between 2014 and 2023; TP = total publications; TC = total citations; C/P = citations per paper; H = h-index available in Scopus. This table includes documents only up to December 31, 2023. The figures in bold are for IRRODL.
Table 2 reveals that Computers and Education and Review of Educational Research lead in terms of overall citations, citations per paper, and the h-index for the last 10 years. These journals represent pillars in educational research, not only due to their broader citation counts but also due to their sustained impact in key areas, for example, technology in education and comprehensive educational review studies.
Other notable journals are the British Journal of Educational Technology and the Journal of Educational Psychology. However, IRRODL is consistently positioned among these top-tier journals, showcasing a robust performance in terms of both its publication volume and the impact of its highly cited articles.
Table 3 lists the 30 most cited documents published in IRRODL over its 25-year history. The citation count for these top papers highlights both the quality and the relevance of the research disseminated by the journal. The most cited papers are diverse in terms of topics, ranging from the pedagogical implications of online education to the development of technological tools that enhance the learning experience in distributed environments.
Table 3
The 30 Most Cited Documents of IRRODL
| R | TC, n | Title | Author(s) | Year | C/Y |
| 1 | 794 | MOOCs: A systematic study of the published literature 2008-2012 | Liyanagunawardena, Adams, & Williams | 2013 | 72.18 |
| 2 | 658 | Building sense of community at a distance | Rovai | 2002 | 29.91 |
| 3 | 634 | Initial trends in enrolment and completion of massive open online courses | Jordan | 2014 | 63.40 |
| 4 | 567 | Blended learning and sense of community: A comparative analysis with traditional and fully online graduate courses | Rovai & Jordan | 2004 | 28.35 |
| 5 | 525 | Defining, discussing, and evaluating mobile learning: The moving finger writes and having writ... | Traxler | 2007 | 30.88 |
| 6 | 499 | A pedagogical framework for mobile learning: Categorizing educational applications of mobile technologies into four types | Park | 2011 | 38.38 |
| 7 | 491 | Three generations of distance education pedagogy | Anderson & Dron | 2011 | 37.77 |
| 8 | 432 | Heutagogy and lifelong learning: A review of heutagogical practice and self-determined learning | Blaschke | 2012 | 36.00 |
| 9 | 430 | The challenges to connectivist learning on open online networks: Learning experiences during a massive open online course | Kop | 2011 | 33.08 |
| 10 | 419 | Getting the mix right again: An updated and theoretical rationale for interaction | Anderson | 2003 | 19.95 |
| 11 | 327 | A predictive study of student satisfaction in online education programs | Kuo, Walker, Belland, & Schroder | 2013 | 29.73 |
| 12 | 322 | Connectivism: Learning theory of the future or vestige of the past? | Kop & Hill | 2008 | 20.13 |
| 13 | 314 | Building an inclusive definition of e-learning: An approach to the conceptual framework | Sangrà, Vlachopoulos, & Cabrera | 2012 | 26.17 |
| 14 | 313 | Virtual spaces: Employing a synchronous online classroom to facilitate student engagement in online learning | McBrien, Jones, & Cheng | 2009 | 20.87 |
| 15 | 308 | A pedagogy of abundance or a pedagogy to support human beings? Participant support on massive open online courses | Kop, Fournier, & Mak | 2011 | 23.69 |
| 16 | 297 | Massive open online course completion rates revisited: Assessment, length and attrition | Jordan | 2015 | 33.00 |
| 17 | 277 | Creating effective collaborative learning groups in an online environment | Brindley, Walti, & Blaschke | 2009 | 18.47 |
| 18 | 260 | Theoretical challenges for distance education in the 21st century: A shift from structural to transactional issues | Garrison | 2000 | 10.83 |
| 19 | 260 | Investigating instructional strategies for using social media in formal and informal learning | Chen & Bryer | 2012 | 21.67 |
| 20 | 259 | The technological dimension of a massive open online course: The case of the CCK08 course tools | Fini | 2009 | 17.27 |
| 21 | 258 | A systematic analysis and synthesis of the empirical MOOC literature published in 2013-2015 | Veletsianos & Shepherdson | 2016 | 32.25 |
| 22 | 254 | Factors influencing students' acceptance of m-learning: An investigation in higher education | Abu-Al-Aish & Love | 2013 | 23.09 |
| 23 | 248 | Profiles in self-regulated learning in the online learning environment | Barnard-Brak, Lan, & Paton | 2010 | 17.71 |
| 24 | 244 | The relationship between self-regulation and online learning in a blended learning context | Lynch & Dembo | 2004 | 12.20 |
| 25 | 239 | Flipped classroom research and trends from different fields of study | Zainuddin & Halili | 2016 | 29.88 |
| 26 | 226 | Using mobile phones to improve educational outcomes: An analysis of evidence from Asia | Valk, Rashid, & Elder | 2010 | 16.14 |
| 27 | 226 | Mobile usability in educational contexts: What have we learnt? | Kukulska-Hulme | 2007 | 13.29 |
| 28 | 225 | Where is research on massive open online courses headed? A data analysis of the MOOC research initiative | Gašević, Kovanović, Joksimović, & Siemens | 2014 | 22.50 |
| 29 | 214 | Open educational resources: Enabling universal education | Caswell, Henson, Jensen, & Wiley | 2008 | 13.38 |
| 30 | 213 | Online instruction, e-learning, and student satisfaction: A three year study | Cole, Shelley, & Swartz | 2014 | 21.30 |
Note. R = rank; TC = total citations; C/Y = citations per year.
The most cited document is “MOOCs: A systematic study of the published literature 2008–2012” by Liyanagunawardena et al. (2013), with 794 citations, reflecting the strong academic interest in MOOCs and online education, followed by “Building sense of community at a distance” by Rovai (2002), and “Initial trends in enrolment and completion of massive open online courses” by Jordan.Haga clic o pulse aquí para escribir texto.
Several key themes emerge from this list of top-cited documents. Research on massive open online courses (MOOCs), learner engagement, and digital pedagogies features prominently. Furthermore, the strong representation of research focused on the development of open educational resources (OER) and the pedagogical strategy for enhancing online learning indicates the journal’s pivotal role in shaping discussions around educational technology and innovation.
Table 4 provides a comprehensive analysis of the most productive and influential authors in the journal over its 25-year history. The data reflect the central role of key contributors in shaping research in open and distributed learning.
Terry Anderson from Athabasca University leads with 12 publications and a total of 1,198 citations, highlighting his significant influence with a high C/P ratio of 99.83. Following Anderson, David Wiley from Lumen Learning ranks second with 12 publications and 784 citations, giving him a solid C/P ratio of 65.33
Other prominent authors who have also made substantial contributions with multiple publications and high citation counts are Aras Bozkurt, Rory McGreal, Olaf Zawacki-Richter, and George Veletsianos. Note that 7 authors in Table 4 work at Athabasca University. The USA leads with 12 authors, followed by Canada with eight.
Table 4
Top 30 Most Productive Authors Published in IRRODL
| R | Author | University or other affiliation | Country | TP | TC | H | C/P | Articles, n | |
| ≥ 100 citations | ≥ 10 citations | ||||||||
| 1 | Anderson, T. | Athabasca U | Canada | 12 | 1,198 | 9 | 99.83 | 2 | 9 |
| 2 | Wiley, D. | Lumen Learning | USA | 12 | 784 | 11 | 65.33 | 2 | 12 |
| 3 | Bozkurt, A. | Anadolu U | Turkey | 11 | 516 | 8 | 46.91 | 3 | 8 |
| 4 | McGreal, R. | Athabasca U | Canada | 11 | 198 | 5 | 18 | 0 | 4 |
| 5 | Zawacki-Richter, O. | U Oldenburg | Germany | 10 | 523 | 9 | 52.3 | 3 | 8 |
| 6 | Veletsianos, G. | U Minnesota | USA | 9 | 641 | 8 | 71.22 | 2 | 7 |
| 7 | Hilton, J. | Brigham Young U | USA | 8 | 330 | 7 | 41.25 | 1 | 7 |
| 8 | Baggaley, J. | Athabasca U | Canada | 7 | 30 | 4 | 4.28 | 0 | 0 |
| 9 | Bonk, C. J. | Indiana U Bloomington | USA | 7 | 206 | 6 | 29.43 | 0 | 4 |
| 10 | Jung, I. | Seoul National U | South Korea | 7 | 183 | 7 | 26.14 | 0 | 7 |
| 11 | Borup, J. | George Manson U | USA | 6 | 111 | 4 | 18.5 | 0 | 3 |
| 12 | Ching, Y. H. | Boise State U | USA | 6 | 200 | 6 | 33.33 | 0 | 6 |
| 13 | Fahy, P. J. | Athabasca U | Canada | 6 | 175 | 4 | 29.16 | 1 | 1 |
| 14 | Kimmons, R. | Brigham Young U | USA | 6 | 177 | 6 | 29.5 | 0 | 4 |
| 15 | Prinsloo, P. | U South Africa | South Africa | 6 | 151 | 6 | 25.16 | 0 | 6 |
| 16 | Sangrà, A. | Open U Catalonia | Spain | 6 | 450 | 6 | 75 | 1 | 6 |
| 17 | West, R.E. | Brigham Young U | USA | 6 | 146 | 5 | 24.33 | 0 | 4 |
| 18 | Abeywardena, I. S. | U Waterloo | Canada | 5 | 26 | 4 | 5.2 | 0 | 1 |
| 19 | Barbour, M. K. | Isabelle Farrington College | USA | 5 | 222 | 5 | 44.4 | 1 | 4 |
| 20 | Cleveland-Innes, M. | Athabasca U | Canada | 5 | 244 | 4 | 48.8 | 1 | 2 |
| 21 | Costley, J. | UAE U | United Arab Emirates | 5 | 70 | 5 | 14 | 0 | 3 |
| 22 | Graham, C. R. | Brigham U | USA | 5 | 212 | 4 | 42.4 | 0 | 4 |
| 23 | Schuwer, R. | OER Consultancy | Netherlands | 5 | 149 | 5 | 29.8 | 0 | 5 |
| 24 | Mackness, J. | Independent Consultant | UK | 4 | 311 | 4 | 77.75 | 1 | 4 |
| 25 | Aydin, C. H. | Anadolu U | Turkey | 4 | 294 | 4 | 73.5 | 1 | 4 |
| 26 | Ally, M. | Athabasca U | Canada | 4 | 273 | 4 | 68.25 | 1 | 4 |
| 27 | Shea, P. | SUNY Albany | USA | 4 | 270 | 4 | 67.5 | 1 | 4 |
| 28 | Richardson, J. C. | Purdue U | USA | 4 | 266 | 4 | 66.5 | 1 | 4 |
| 29 | Annand, D. | Athabasca U | Canada | 4 | 185 | 4 | 46.25 | 1 | 4 |
| 30 | Gulbahar, Y. | Ankara U | Turkey | 4 | 168 | 4 | 42 | 1 | 4 |
Note. R = rank; TP = total publications; TC = total citations; H = h-index available in Scopus; C/P = citations per publication.
Table 5 highlights the key academic institutions that have significantly contributed to the journal’s body of research over the past 25 years.
IRRODL’s publisher, Athabasca University in Canada, leads with 128 publications and over 4,031 citations. It has a strong h-index of 30 and a notable C/P ratio of 31.49. Other leading institutions include the University of South Africa, The Open University, and Brigham Young University, all of which demonstrate strong academic contributions with high citation counts and significant papers with equal or more than 100 citations. Note that the USA has eight institutions in Table 5 and Canada, six.
Table 5
The Most Productive and Influential Institutions Contributing to IRRODL
| R | Institution | Country | TP | TC | H | C/P | Articles, n | |
| ≥ 100 citations | ≥ 10 citations | |||||||
| 1 | Athabasca U | Canada | 128 | 4,031 | 30 | 31.49 | 10 | 57 |
| 2 | U South Africa | South Africa | 44 | 994 | 20 | 22.59 | 1 | 35 |
| 3 | Open U | UK | 36 | 2,093 | 21 | 58.14 | 4 | 30 |
| 4 | Brigham Young U | USA | 33 | 1,064 | 18 | 32.24 | 1 | 24 |
| 5 | Open U Catalonia | Spain | 31 | 1,262 | 19 | 40.71 | 2 | 26 |
| 6 | Anadolu U | Turkey | 20 | 765 | 12 | 38.25 | 4 | 13 |
| 7 | Purdue U | USA | 16 | 567 | 12 | 35.44 | 1 | 13 |
| 8 | U Oldenburg | Germany | 14 | 1,099 | 9 | 78.50 | 4 | 9 |
| 9 | Open U | Netherlands | 14 | 268 | 11 | 19.14 | 0 | 11 |
| 10 | Boise State U | USA | 12 | 380 | 10 | 31.67 | 0 | 10 |
| 11 | Beijing Normal U | China | 12 | 359 | 9 | 29.92 | 0 | 9 |
| 12 | U British Columbia | Canada | 11 | 225 | 7 | 20.45 | 0 | 7 |
| 13 | Pennsylvania State U | USA | 9 | 297 | 8 | 33.00 | 1 | 6 |
| 14 | Ankara U | Turkey | 9 | 286 | 7 | 31.78 | 2 | 5 |
| 15 | Fern U Hagen | Germany | 9 | 455 | 8 | 50.56 | 1 | 8 |
| 16 | Open U Israel | Israel | 9 | 350 | 8 | 38.89 | 1 | 8 |
| 17 | UNED | Spain | 9 | 153 | 7 | 17.00 | 0 | 5 |
| 18 | U South Australia | Australia | 9 | 217 | 8 | 24.11 | 0 | 5 |
| 19 | U Florida | USA | 8 | 307 | 7 | 38.38 | 1 | 6 |
| 20 | Royal Roads U | Canada | 8 | 435 | 6 | 54.38 | 1 | 5 |
| 21 | U Alberta | Canada | 8 | 175 | 7 | 21.88 | 0 | 6 |
| 22 | U Calgary | Canada | 7 | 427 | 6 | 61.00 | 2 | 6 |
| 23 | Tel Aviv U | Israel | 7 | 208 | 7 | 29.71 | 0 | 7 |
| 24 | Old Dominion U | USA | 7 | 357 | 7 | 51.00 | 1 | 7 |
| 25 | George Mason U | USA | 7 | 120 | 5 | 17.14 | 0 | 3 |
| 26 | National Central U | Taiwan | 7 | 119 | 6 | 17.00 | 0 | 5 |
| 27 | Utah State U | USA | 7 | 698 | 7 | 99.71 | 2 | 6 |
| 28 | Thompson Rivers U | Canada | 7 | 114 | 4 | 16.29 | 0 | 3 |
| 29 | National Open U Nigeria | Nigeria | 7 | 102 | 5 | 14.57 | 0 | 4 |
Note. R = rank; TP = total publications; TC = total citations; H = h-index available in Scopus; C/P = citations per publication. There are also 12 universities tied in the 30th position with 6 documents each. Not listed here because of space considerations.
Table 6 presents a detailed overview of the countries that have made significant contributions to the journal over its 25-year history.
The United States leads the ranking. Canada follows with approximately two thirds as many publications and half as many citations. Other notable countries include the United Kingdom, Turkey, and South Africa, each contributing a significant number of publications and citations, underscoring their influence in the field of open and distributed learning.
This table highlights the global impact of research in IRRODL, with contributions from countries across North America, Europe, Asia, and Africa. It reflects the growing international collaboration in educational research, particularly in the areas of online learning and digital education technologies.
Table 6
The Most Productive and Influential Countries in IRRODL Publications
| R | Country | TP | TC | H | C/P | Articles, n | P/Po | C/Po | |
| ≥ 100 citations | ≥ 10 citations | ||||||||
| 1 | United States | 309 | 14,977 | 69 | 48.47 | 37 | 225 | 0.90 | 43.41 |
| 2 | Canada | 211 | 7,556 | 41 | 35.81 | 18 | 109 | 5.40 | 193.25 |
| 3 | United Kingdom | 95 | 6,279 | 36 | 66.09 | 15 | 78 | 1.37 | 90.74 |
| 4 | Turkey | 66 | 1,898 | 24 | 28.76 | 7 | 41 | 0.76 | 21.72 |
| 5 | South Africa | 62 | 1,263 | 21 | 20.37 | 1 | 47 | 0.98 | 20.05 |
| 6 | Spain | 62 | 2,003 | 25 | 32.30 | 2 | 45 | 1.29 | 41.82 |
| 7 | Australia | 52 | 1,214 | 21 | 23.34 | 1 | 30 | 1.90 | 44.31 |
| 8 | China | 57 | 1,353 | 20 | 23.74 | 1 | 37 | 0.05 | 1.30 |
| 9 | Taiwan | 40 | 904 | 18 | 22.6 | 1 | 27 | 1.67 | 37.82 |
| 10 | Germany | 38 | 2,038 | 23 | 53.63 | 6 | 28 | 0.45 | 24.12 |
| 11 | South Korea | 36 | 1,105 | 18 | 30.70 | 2 | 30 | 0.70 | 21.54 |
| 12 | Malaysia | 25 | 754 | 14 | 30.16 | 1 | 16 | 0.73 | 22.11 |
| 13 | Netherlands | 23 | 545 | 17 | 32.05 | 0 | 19 | 1.33 | 31.50 |
| 14 | Israel | 21 | 742 | 14 | 35.33 | 2 | 19 | 2.23 | 78.94 |
| 15 | New Zealand | 19 | 798 | 12 | 42 | 1 | 13 | 3.65 | 153.46 |
| 16 | Sweden | 17 | 225 | 10 | 13.24 | 0 | 8 | 1.60 | 21.23 |
| 17 | Greece | 15 | 490 | 10 | 32.67 | 2 | 9 | 1.50 | 49.00 |
| 18 | Iran | 15 | 80 | 7 | 5.33 | 0 | 3 | 0.17 | 0.89 |
| 19 | Nigeria | 15 | 194 | 7 | 12.93 | 0 | 7 | 0.06 | 0.83 |
| 20 | India | 14 | 212 | 8 | 15.14 | 0 | 7 | 0.01 | 0.15 |
| 21 | Japan | 14 | 1,096 | 10 | 78.28 | 1 | 10 | 0.11 | 8.86 |
| 22 | Brazil | 12 | 167 | 7 | 13.92 | 0 | 6 | 0.06 | 0.79 |
| 23 | Portugal | 12 | 245 | 8 | 20.42 | 0 | 8 | 1.15 | 23.56 |
| 24 | Mexico | 11 | 95 | 6 | 8.64 | 0 | 4 | 0.08 | 0.73 |
| 25 | Norway | 11 | 278 | 8 | 25.27 | 1 | 7 | 2.00 | 50.55 |
| 26 | France | 9 | 59 | 5 | 6.55 | 0 | 3 | 0.14 | 0.89 |
| 27 | Indonesia | 9 | 451 | 7 | 50.11 | 1 | 6 | 0.03 | 1.59 |
| 28 | Switzerland | 9 | 418 | 7 | 46.44 | 1 | 7 | 1.03 | 48.05 |
Note. R = rank; TP = total publications; TC = total citations; H = h-index available in Scopus; C/P = citations per publication; P/Po = number of papers per million inhabitants; C/Po = number of citations per million inhabitants. There are 4 countries tied in the 29th position with 8 papers each. Not listed here for space considerations.
In 2025, IRRODL celebrates 25 years. To mark this anniversary, this study has presented a bibliometric overview of the leading trends of the journal between 2000 and 2023. This bibliometric analysis provides a comprehensive overview of IRRODL’s impact, examining the evolution of its publication and citation structure, leading contributors, and geographic trends. The findings show IRRODL’s sustained growth in reach and academic influence, establishing it as a cornerstone for research in open education and digital pedagogies.
Since its inception, IRRODL has experienced steady increases in both publications and citations, mirroring global trends in the educational technology and open learning fields. The journal’s annual publication count has grown consistently, peaking at 104 articles in 2017, after which a policy change limited the number of research articles to 40 per year. IRRODL’s citation structure further reflects this growth: as of 2023, the journal has amassed more than 42,000 citations with a substantial h-index of 95. This extensive citation reach, paired with a high h-index, attests to the significant academic value and quality of research disseminated through IRRODL, with numerous articles among the top-cited references in digital learning research.
The international nature of IRRODL’s contributions reflects the journal’s reach across a diverse array of educational contexts. The United States leads in terms of publications and citations, followed closely by Canada, the United Kingdom, and China, highlighting these nations’ strong influence on global educational research. Notably, IRRODL’s publisher, Athabasca University in Canada, ranks as the most productive institution, aligning with its reputation as a pioneering institution in distance education. Other leading institutions include the University of South Africa, Beijing Normal University, and The Open University (UK), all of which have consistently contributed to IRRODL.
While historically dominated by North American and European contributions, IRRODL has seen an increase in publications from institutions in developing countries, such as Turkey, Malaysia, and South Africa. This trend emphasizes the journal’s role in promoting educational research across varied contexts, enhancing the inclusivity of perspectives in digital learning. Emerging countries, particularly Turkey, have made significant contributions, evidencing IRRODL’s impact on expanding research from regions that are rapidly embracing educational technologies. This international scope not only supports a diversified understanding of digital learning but also allows for the dissemination of innovative pedagogical practices adaptable to a variety of cultural and technological contexts.
IRRODL’s ability to attract influential articles and consistently high citation rates signals its established role in educational research. Looking forward, sustaining this growth will require ongoing responsiveness to technological advancements and pedagogical shifts, particularly as digital education increasingly incorporates elements of personalized and data-driven learning. Enhancing contributions from emerging regions and exploring new topics such as AI and virtual learning environments could further strengthen IRRODL’s position as an inclusive and forward-looking publication.
This study has provided a representative bibliometric analysis of IRRODL’s impact over its 25-year history, though certain limitations are inherent to bibliometric methodologies. Citation data, while insightful, may not fully capture the interdisciplinary and applied impact of research, particularly for studies with applications outside academia. Additionally, this analysis relies on Scopus data, which, although comprehensive, may omit relevant contributions from other indexing databases. These factors underscore the importance of considering multiple perspectives when evaluating IRRODL’s scholarly impact.
In sum, IRRODL’s 25-year history reflects a remarkable trajectory of growth and influence, cementing its role as a foundational publication in open and distributed learning. The journal has successfully navigated shifts in the educational landscape, demonstrating resilience and adaptability to emerging trends and new research needs. Looking ahead, IRRODL is well-positioned to continue as a leader in digital education research, fostering innovative scholarship that not only addresses current challenges but also anticipates future directions in the field of educational technology.
Akturk, A. O. (2022). Thirty‐five years of the Journal of Computer Assisted Learning: A bibliometric overview. Journal of Computer Assisted Learning, 38(5), 1220-1253. https://doi.org/10.1111/jcal.12686
Alonso, S., Cabrerizo, F. J., Herrera-Viedma, E., & Herrera, F. (2009). h-index: A review focused on its variants, computation, and standardization for different scientific fields. Journal of Informetrics, 3(4), 273-289. https://doi.org/10.1016/j.joi.2009.04.001
Anderson, T., Cookson, P. S., Henderson, S., & McGreal, R. (2025). Twenty-five years of innovation and knowledge sharing: The legacy and future of the International Review of Research in Open and Distributed Learning. The International Review of Research in Open and Distributed Learning, 26(1), 1-15. https://doi.org/10.19173/irrodl.v26i1.8490
Arrow, K. J., Bernheim, B. D., Feldstein, M. S., McFadden, D. L., Poterba, J. M., & Solow, R. M. (2011). 100 years of the American Economic Review: The top 20 articles. American Economic Review, 101(1), 1-8. https://www.doi.org/10.1257/aer.101.1.1
Bar-llan, J. (2008). Informetrics at the beginning of the 21 century—A review. Journal of Informetrics, 2(1), 1-52. https://doi.org/10.1016/j.joi.2007.11.001
Bensman, S. J. (2007). Garfield and the impact factor. Annual Review of Information Science and Technology, 41(1) 93-155. https://doi.org/10.1002/aris.2007.1440410110
Bergstrom, C. T., West, J. D., & Wiseman, M. A. (2008). The Eigenfactor Metrics. Journal of Neuroscience, 28(45), 11433-11434. https://doi.org/10.1523/JNEUROSCI.0003-08.2008
Broadus, R. N. (1987). Toward a definition of “Bibliometrics.” Scientometrics, 12(5-6), 373-379. https://doi.org/10.1007/BF02016680
Chen, X., Zou, D., & Xie, H. (2020). Fifty years of British Journal of Educational Technology: A topic modeling based bibliometric perspective. British Journal of Educational Technology, 51(3), 692-708. https://doi.org/10.1111/bjet.12907
Cheng, B., Wang, M., Mørch, A. I., Chen, N. S., Kinshuk, & Spector, J. M. (2014). Research on e-learning in the workplace 2000–2012: A bibliometric analysis of the literature. Educational Research Review, 11, 56-72. https://doi.org/10.1016/j.edurev.2014.01.001
Clarivate. (2024). Journal citation reports. Clarivate. https://clarivate.com/academia-government/scientific-and-academic-research/research-funding-analytics/journal-citation-reports/
Cole, F. J., & Eales, N. B. (1917). The history of comparative anatomy: Part 1 — A statistical analysis of the literature. Science Progress, 11(44), 578-596. https://www.jstor.org/stable/43426882
Ding, Y., Rousseau, R., & Wolfram, D. (Eds.). (2014). Measuring scholarly impact: Methods and practice. Springer Nature. https://link.springer.com/book/10.1007/978-3-319-10377-8
Donthu, N., Kumar, S., Mukherjee, D., Pandey, N., & Lim, W. M. (2021). How to conduct a bibliometric analysis: An overview and guidelines. Journal of Business Research, 133, 285-296. https://doi.org/10.1016/j.jbusres.2021.04.070
Durak, G., Çankaya, S., & Can, S. (2024). Artificial intelligence in education: A bibliometric study on its role in transforming teaching and learning. The International Review of Research in Open and Distance Learning, 25(3), 219-244. https://doi.org/10.19173/irrodl.v25i3.7757
Durepos, G., Maclean, M., Alcadipani, R., & Cummings, S. (2020). Historical reflections at the intersection of past and future: Celebrating 50 years of Management Learning. Management Learning, 51(1), 3-16. https://doi.org/10.1177/1350507619879603
Figuerola-Wischke, A., Merigó, J. M., Gil-Lafuente, A. M., Kydland, F. E., & Amiguet, L. (2024). The Scandinavian Journal of Economics at 125: A bibliometric overview. The Scandinavian Journal of Economics, 126(4), 643-697. https://doi.org/10.1111/sjoe.12582
Garfield, E. (1955). Citation indexes for science: A new dimension in documentation through association of ideas. Science, 122(3159), 108-111. https://www.doi.org/10.1126/science.122.3159.108
Glanzel, W., Moed, H. F., Schmoch, U., & Thelwall, M. (2019). Springer handbook of science and technology indicators. Springer Nature. https://link.springer.com/book/10.1007/978-3-030-02511-3
Hallinger, P. (2023). An empirical reflection on Educational Administration Quarterly ’s distinctive contributions to the field, 1965–2020. Educational Administration Quarterly, 59(5), 884-913. https://doi.org/10.1177/0013161X231200883
Hirsch, J. E. (2005). An index to quantify an individual’s scientific research output. Proceedings of the National Academy of Sciences of the United States of America, 102(46), 16569-16572. https://doi.org/10.1073/pnas.0507655102
Hussain, W., Merigó, J. M., Rahimi, I., & Lev, B. (2025). Half a century of Omega–The International Journal of Management Science: A bibliometric analysis. Omega–International Journal of Management Science, 133, Article 103226. https://doi.org/10.1016/j.omega.2024.103226
Jordan, K. (2014). Initial trends in enrolment and completion of massive open online courses. The International Review of Research in Open and Distributed Learning, 15(1). https://doi.org/10.19173/irrodl.v15i1.1651
Liyanagunawardena, T. R., Adams, A. A., & Williams, S. A. (2013). MOOCs: A systematic study of the published literature 2008–2012. The International Review of Research in Open and Distributed Learning, 14(3), 202-227. https://doi.org/10.19173/irrodl.v14i3.1455
Merigó, J. M., Cancino, C., Coronado, F., & Urbano, D. (2016). Academic research in innovation: A country analysis. Scientometrics, 108, 559-593. https://doi.org/10.1007/s11192-016-1984-4
Monastersky, R., & Van Noorden, R. (2019). 150 years of Nature: A data graphic charts our evolution. Nature, 575(7781), 22-23. https://doi.org/10.1038/d41586-019-03305-w
Podsakoff, P. M., MacKenzie, S. B., Podsakoff, N. P., & Bachrach, D. G. (2008). Scholarly influence in the field of management: A bibliometric analysis of the determinants of university and author impact in the management literature in the past quarter century. Journal of Management, 34(4), 641-720. https://doi.org/10.1177/0149206308319533
Pritchard, A. (1969). Statistical bibliography or bibliometrics? Journal of Documentation, 25, 348-349.
Rialp, A., Merigó, J. M., Cancino, C. A., & Urbano, D. (2019). Twenty-five years (1992–2016) of the International Business Review: A bibliometric overview. International Business Review, 28(6), Article 101587. https://doi.org/10.1016/j.ibusrev.2019.101587
Rojas-Sánchez, M. A., Palos-Sánchez, P. R., & Folgado-Fernández, J. A. (2023). Systematic literature review and bibliometric analysis on virtual reality and education. Education and Information Technologies, 28, 155-192. https://doi.org/10.1007/s10639-022-11167-5
Rousseau, R. (2014). Forgotten founder of bibliometrics. Nature, 510, 218. https://doi.org/10.1038/510218e
Rovai, A. P. (2002). Building sense of community at a distance. The International Review of Research in Open and Distributed Learning, 3(1). https://doi.org/10.19173/irrodl.v3i1.79
Scopus. (2024). Scopus Database. https://www.scopus.com/
Tukey, J. W. (1977). Exploratory data analysis. Addison-Wesley.
Wilson, M. L. (2022). Topics, author profiles, and collaboration networks in the Journal of Research on Technology in Education: A bibliometric analysis of 20 years of research. Journal of Research on Technology in Education, 56(3), 291-313. https://doi.org/10.1080/15391523.2022.2134236
Zurita, G., Mulet-Forteza, C., Merigó, J. M., Lobos-Ossandon, V., & Ogata, H. (2022). A bibliometric overview of the IEEE Transactions on Learning Technologies. IEEE Transactions on Learning Technologies, 15(6), 656-672. https://www.doi.org/10.1109/TLT.2022.3204457

Twenty-Five Years of the International Review of Research in Open and Distributed Learning: A Bibliometric Analysis by Carlos J. Torres-Vergara, Víctor G. Alfaro-García, José M. Merigó, Amara Atif, and Rory McGreal is licensed under a Creative Commons Attribution 4.0 International License.