Volume 26, Number 1
Xieling Chen1, Di Zou2, Haoran Xie3, Gary Cheng4, Zongxi Li5, and Fu Lee Wang6
1School of Education, Guangzhou University, Guangzhou, China; 2Department of English and Communication, The Hong Kong Polytechnic University, Hong Kong SAR; 3School of Data Science, Lingnan University, Hong Kong SAR; 4Department of Mathematics and Information Technology, The Education University of Hong Kong, Hong Kong SAR; 5School of Data Science, Lingnan University, Hong Kong SAR; 6School of Science and Technology, Hong Kong Metropolitan University, Hong Kong SAR
Massive open online courses (MOOCs) offer rich opportunities to comprehend learners’ learning experiences by examining their self-generated course evaluation content. This study investigated the effectiveness of fine-tuned BERT models for the automated classification of topics in online course reviews and explored the variations of these topics across different disciplines and course rating groups. Based on 364,660 course review sentences across 13 disciplines from Class Central, 10 topic categories were identified automatically by a BERT-BiLSTM-Attention model, highlighting the potential of fine-tuned BERTs in analysing large-scale MOOC reviews. Topic distribution analyses across disciplines showed that learners in technical fields were engaged with assessment-related issues. Significant differences in topic frequencies between high- and low-star rating courses indicated the critical role of course quality and instructor support in shaping learner satisfaction. This study also provided implications for improving learner satisfaction through interventions in course design and implementation to monitor learners’ evolving needs effectively.
Keywords: learner-generated content, automatic classification, fine-tuned, BERTs, course evaluation
Online education has experienced a substantial surge in popularity, offering individuals the flexibility to learn without the constraints of physical classroom attendance. Massive open online courses (MOOCs), as a widely adopted mode of digital learning, have provided distance learners with abundant learning materials, interactive environments, and the freedom to select their study schedules (Liu et al., 2023); thus, an increasing number of educational institutions have developed MOOC courses.
MOOCs have offered opportunities for students to exchange perspectives on their learning experiences by writing course reviews, resulting in large-scale learner-generated content available for online educational data analytics (Chen et al., 2024) that offers insights into learners’ learning experiences and preferences (Hew et al., 2020).
One common approach to analysing online course reviews has involved categorizing review content into specific features using coding categories. For instance, Hew (2016) developed a coding system based on quantitative content analysis (QCA) of 4,466 course reviews to pinpoint factors contributing to MOOC learners’ engagement. While QCA effectively analyses small amounts of textual data, it is challenging to deal with large-scale course reviews. Furthermore, QCA cannot offer timely feedback on learners’ experiences to instructors and designers for their decision-making about interventions to increase completion rates of MOOCs.
Given the limitations of QCA, several automated classifiers have been developed to automatically identify topics within online course reviews. For instance, Li et al. (2022) employed an ontology of key topics and associated keywords to analyse the proportion of reviews mentioning these topics in order to establish a foundational understanding of learner feedback. Similarly, Chen et al. (2024) developed classifiers based on deep learning methods such as convolutional neural networks (CNNs) for the automatic examination of course evaluation texts. Although these methods have reduced labour costs and enabled automatic detection, their performance has relied heavily on distinct manually-created characteristics, and has been constrained by obstacles such as imbalanced sample sizes and unregistered words.
Compared to the aforementioned traditional machine learning and deep learning algorithms, bidirectional encoder representations from transformers (BERTs) can reduce the necessity for laborious feature engineering and have gained wide application and contributed significantly to enhancing performance in various natural language processing (NLP) tasks (El-Rashidy et al., 2023). With the ability to continuously pretrain on a large domain-specific corpus, BERT has shown promise for facilitating the classification of topics within MOOC course reviews.
However, there has been limited research on fine-tuned BERTs combined with text mining for MOOC review analytics. Thus, this study aimed to propose a hybrid approach for analysing online reviews in MOOCs to predict learner preferences and aid instructors in decision-making. Specifically, we first introduced a BERT-BiLSTM-Attention model specific to MOOC review analysis and explored its performance in identifying review topics. The model used BERT as an encoder to represent the review texts by incorporating the position and context of a word in a sentence, with BiLSTM (bidirectional long short-term memory network) and attention mechanisms for capturing review texts’ global contextual information to predict review topics. Based on the prediction results, we further exploited statistical modelling to understand topic distributions across disciplines and course rating groups. Accordingly, we addressed three research questions:
RQ1: To what extent is the use of BERT models effective in identifying review topics within online course review data?
RQ2: What level of effectiveness does the employment of BERT models exhibit in categorizing reviews into various topic categories?
RQ3: How do review topic categories differ across various disciplinary domains and course rating groups?
Our contributions included four aspects. First, we developed a BERT-BiLSTM-Attention model for analysing the thematic orientation of online course reviews by exploiting BERTs to represent review textual features, BiLSTM to capture global review context, and attention mechanisms to facilitate feature extraction and improve classification. Second, we empirically validated BERT-BiLSTM-Attention’s effectiveness against 10 baselines based on a dataset comprising 364,660 review sentences from 401 courses across 13 disciplines. Furthermore, we highlighted the practical utility of pre-trained language models (PLMs) for big MOOC review textual data analytics to facilitate precise identification of learners’ experiences and timely interventions. Finally, we provided domain-specific insights by revealing variations of learner concerns across disciplines and course groups, shedding light on influential factors for learner satisfaction.
Following previous MOOC review analysis studies (e.g., Chen et al., 2024; Hew et al., 2020), we used Moore’s theory of transactional distance (Moore, 2013) as an initial conceptual framework to promote decision-making concerning MOOC design; however, we did not forcefully impose the three variables (i.e., course structure, learner autonomy, and dialogue) of the theory onto our data corpus.
In Moore’s theory, course structure involves features of course design and organization (e.g., information presentation, course content) used to help learners plan, organize, and manage learning activities. Second, learner autonomy involves learners’ sense of freedom to engage in learning and a degree of control over learning. Finally, dialogue is explained from three dimensions—learner-content, learner-instructor, and learner-learner interaction—focusing on learning content reflection, interaction with teachers, and peer interaction, respectively.
To explore factors affecting online learner experiences, systematic analysis has been broadly used to translate review texts into specific categories through coding analysis involving code development and course review analysis conducted by trained coders (Hew, 2016). However, coding analysis of online course reviews relies heavily on manual efforts to train eligible coders and ensure reliability among them. Additionally, coding itself is a time-consuming endeavour; thus, instructors and course designers may have to wait for an extended period to receive feedback on learners’ learning experiences. Therefore, a model capable of automatically and swiftly classifying a vast amount of online course review texts into appropriate categories while providing prompt feedback would represent a viable solution.
Automatic classification, wherein machines autonomously categorize data into predefined groups, has been shown to be swifter and more cost-efficient compared to manual classification (Chen et al., 2024). The primary automated review topic classification methods have relied largely on traditional text-mining features (e.g., keyword frequencies) and machine learning algorithms. For instance, Li et al. (2022) employed a top-down approach that drew upon subject matter expertise to establish the ontology of main topics and associated keywords for analysing course review topics, and computed the percentage of reviews mentioning these main topics to obtain a basic overview of learner reviews.
In recent times, scholars have employed deep learning methodologies to manage extensive textual data from MOOCs to automatically analyse the topics discussed in online course reviews. For example, Chen et al. (2024) used deep learning approaches such as CNNs to train classifiers for the automatic classification of course review content; the recurrent convolution neural network classifier exhibited an F1-score of 0.780.
The aforementioned approaches have successfully minimized labour costs and enabled automated detection; however, their performance has been affected by challenges such as imbalanced sample sizes and unregistered words, as well as the need for manual extraction of multifaceted and high-dimensional text features. BERT, as a prominent and valuable PLM capable of achieving remarkable performance even with limited and imbalanced datasets compared to traditional machine learning models, has been an effective solution to the above-mentioned challenges encountered by traditional machine learning and deep learning approaches. The training process of BERTs comprises pre-training and fine-tuning, during which BERT acquires comprehensive semantic representations from a substantial volume of text data through self-supervised learning and refines its understanding of domain-specific knowledge through a specialized text classification dataset. Hence, it was worth exploiting BERT’s potential for automating the classification of review topics within MOOCs.
For word embedding models like Word2vec and FastText, regardless of the word’s context, the embedding remains unchanged; thus, these methods generate a unified global portrayal for every word, disregarding its surrounding context. Conversely, BERT offers word representations that adapt according to the surrounding context based on contextual embeddings capable of capturing diverse syntactic and semantic characteristics across language contexts.
BERT, as a pre-trained language representation model that amalgamates the strengths of both embeddings from language models (ELMs) and generative pre-trained transformer (GPT), employs a layered transformer structure for training weights in transfer learning like GPT to enhance its ability to handle long-term dependencies. Similar to ELMs, it uses both left-to-right and right-to-left language models to capture more profound semantics and generate potent sequence representations that excel across a multitude of downstream tasks.
In recent years, the use of the BERT model has expanded into the realm of education, promoting significant advancements across various intelligent education applications. For instance, Wulff et al. (2023) applied BERT to categorize segments of preservice physics instructors’ reflective texts in accordance with elements outlined in a reflection-supporting model, revealing BERT’s superior performance over alternative deep learning models and traditional learning approaches for reflective writing segment classification. Cavalcanti et al. (2023) explored BERT’s application in classifying Portuguese feedback texts of teachers and showcased a 35.71% improvement regarding Cohen’s kappa compared to Cavalcanti et al. (2020) who used the random forest as a classifier.
In the context of MOOCs, based on a dataset encompassing 2,394 learning objectives, Sebbaq and El Faddouli (2022) employed transfer learning via BERTs to automate MOOCs pedagogical annotation at scale, focusing on the cognitive levels outlined in Bloom’s taxonomy. Their findings revealed that opting for a more intricate classifier did not enhance classification performance significantly; instead, using a model built upon BERT layers, in conjunction with dropout and the rectified linear unit activation function, resulted in the highest accuracy.
Despite notable performance in NLP tasks, the exploration of BERT models for classifying course review topics within MOOC learning contexts has remained relatively limited. Hence, this study concentrated on BERTs for enhancing the efficacy of online course review classification.
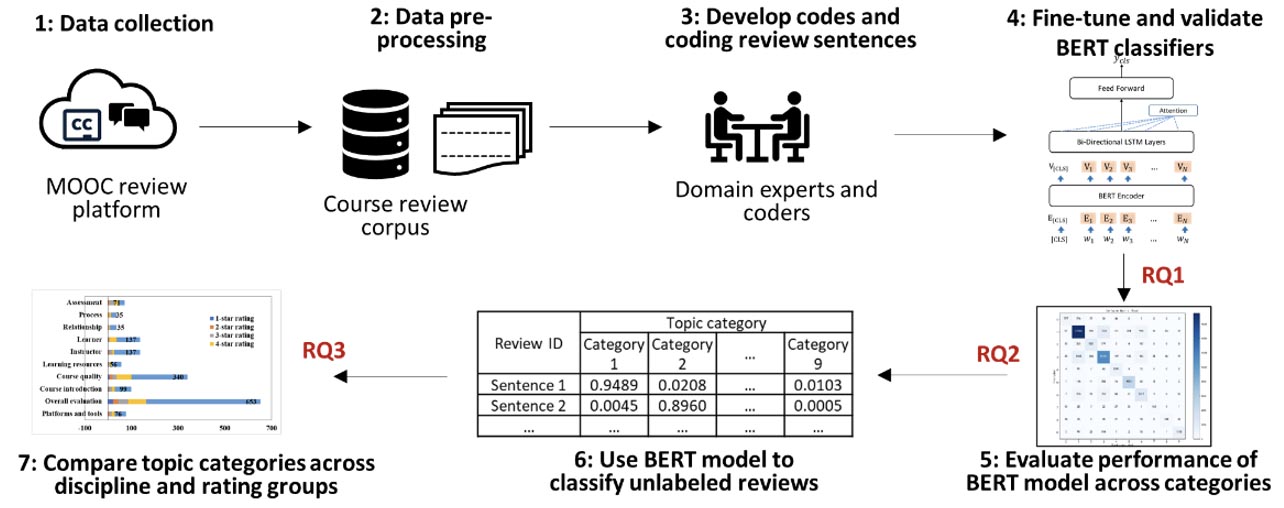
Based on Chen et al.’s (2024) MOOC dataset, this study used BERT-BiLSTM-Attention to automatically categorize MOOC learners’ review topics within their course feedback. The study unfolded through seven steps, as depicted in Figure 1 and outlined below.
Step 1: The original dataset with extensive course review data and course metadata was collected from the Class Central platform.
Step 2: For the original dataset, Chen et al. (2024) used NLP tools for data pre-processing and excluding private information to construct the MOOC-Corpus that contained proper nouns and terms pertinent to MOOCs. To mitigate potential bias arisen, we included domain experts to manually review a sample of the dataset to ensure the pre-processing preserved the essential characteristics of the MOOC reviews.
Step 3: Domain experts and coders devised codes and categorized the review sentences in the MOOC-Corpus according to their associated topic categories.
Step 4: This step addressed RQ1. The BERT-BiLSTM-Attention model and the other 10 baseline models underwent pre-training and fine-tuning on the annotated MOOC-Corpus. Their classification performance was evaluated before and after fine-tuning using accuracy, precision, recall, and F1-score.
Figure 1
Research Design
Step 5: RQ2 was addressed in this step. The fine-tuned BERT-BiLSTM-Attention model’s performance across different topic categories was evaluated using the four metrics. Visualization was achieved through plotting confusion matrices.
Step 6: The fine-tuned BERT-BiLSTM-Attention model from Step 4 was employed to automatically categorize unlabelled course review sentences with topic category labels.
Step 7: This step addressed RQ3. The distribution of review topic categories across discipline domains and course rating groups was analysed and compared in order to reveal differences in learners’ engagement with different disciplines and course groups, as well as learners’ perceptions regarding learning in MOOCs.
As Chen et al. (2024) had already removed learner privacy information, the MOOC-Corpus used in this study did not contain sensitive data that could compromise learner privacy. We further segmented the review texts in the MOOC-Corpus into individual words, rectified spellings, and eliminated stop words using the Natural Language Toolkit. This process yielded 364,660 course review text sentences, sourced from 401 courses spanning 13 disciplines.
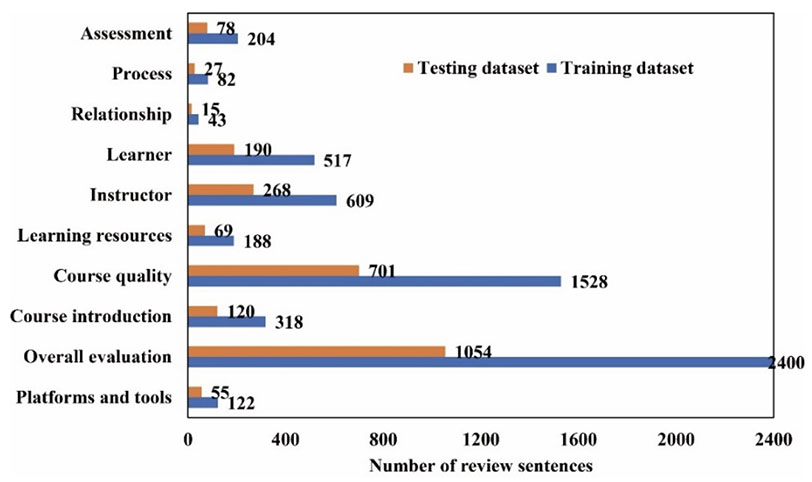
To annotate the MOOC-Corpus for training and assessing the model, two proficient domain specialists devised codes for topic categories in MOOC course reviews (see Appendix), drawing insights from synthesized findings in previous literature (e.g., Chen et al., 2024; Hew et al., 2020). Manual categorization of course review topics was performed by the two specialists based on nine topic categories. To enhance coding precision, we analysed individual sentences, considering them to encapsulate a singular meaning. While multiple codes could be assigned to each review sentence, instances of the same code within a single instance were tallied only once. Initially, a random sample of 1,000 review sentences was selected for independent screening by two coders who had previously been trained to calibrate their understanding and application of the coding scheme to minimize discrepancies and align their assessments. Throughout the screening, regular cross-checks and feedback on the coding scheme were conducted to monitor consistency and allow for timely refinements. The coding outcome yielded a Cohen’s kappa value of 0.930. Any discrepancies were thoroughly deliberated until a consensus was reached. In cases where consensus was not reached, a domain expert, as the third coder, was involved to re-evaluate and make the final decision. Finally, each coder individually labelled the remaining course review sentences. The annotated review data corpus results are presented in Figure 2, comprising 9,996 annotated review sentences.
Figure 2
Number of Review Sentences in Testing and Training Datasets
BERT-BiLSTM-Attention was introduced for categorizing online course reviews into distinct categories based on their semantic meanings. The architecture of BERT-BiLSTM-Attention is shown in Figure 3. The embedding layer transformed the review texts into numerical vector spaces using distributed representations of the embedded words. The second component employed a BiLSTM network to grasp the broader context of the online course reviews. To attain bidirectional semantic dependencies, this study concatenated the hidden states of both the forward and backward LSTMs, allowing for a comprehensive understanding of global contextual semantics by encompassing semantic data from historical and forthcoming contexts.
Figure 3
Architecture of the BERT-BiLSTM-Attention Model
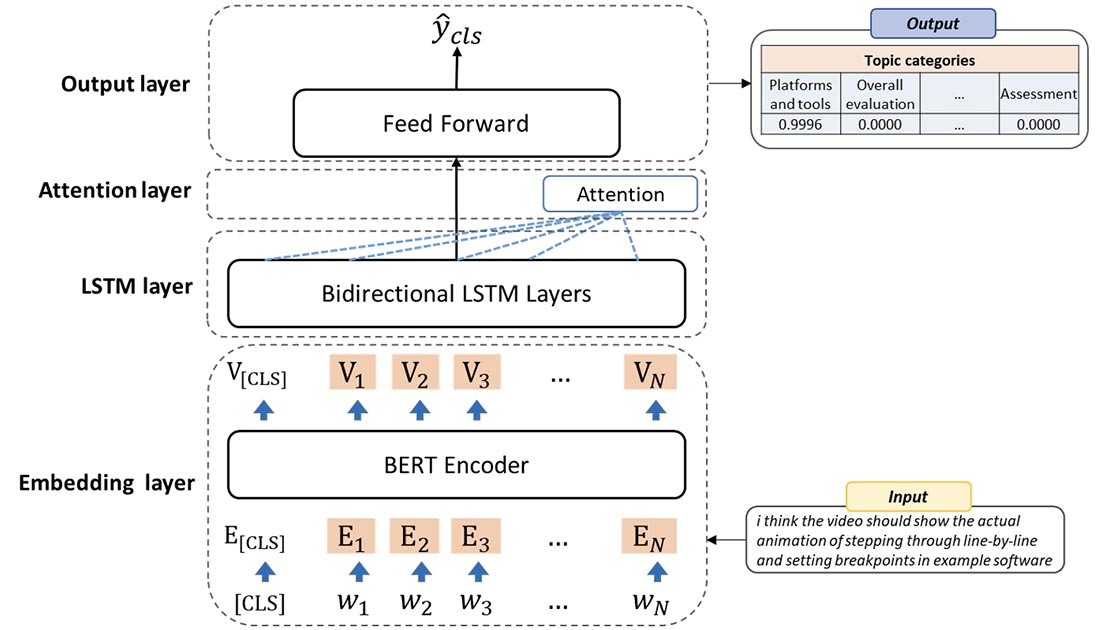
In the attention layer, the attention mechanism calculated word weight and subsequently summed up the hidden states of words in order to capture significant words in the text semantics. Through a Softmax function, the hidden states of the online course reviews in each target and source were standardized between zero and one. The attention weight signified the correlation among the target’s and source’s hidden states, while the context vector represented the source states’ weighted mean. After merging the context vector and the target hidden state, an attention vector was generated, which contained details pertaining to the current focus of attention. The output layer employed a Softmax activation function to compute the probability distributions of categories in order to determine the predicted category with the greatest probability.
The BERT-BiLSTM-Attention model was fine-tuned, tailored to a specific task focused on automatically classifying course review topics. According to Liu et al. (2023), employing a proper fine-tuning approach enhanced a BERT-BiLSTM-Attention model’s performance in subsequent tasks. A comparison of classification performance was conducted between the BERT-BiLSTM-Attention model and 11 baseline methods. These baselines, commonly used in classification studies (e.g., Chen et al., 2024; Liu et al., 2023) can be categorized into two groups. One set of baselines that used BERT for encoding the review texts (i.e., BERT, BERT-CNN, BERT-CNN-BiLSTM, and BERT-BiLSTM) was selected to assess how combining BERT’s contextual embeddings with different neural network structures impacted performance. The other set of baselines that employed Word2Vec for encoding the online course review texts were included to evaluate performance with word embeddings that were less context-aware than BERT. These baseline models included Word2vec-CRNN, Word2vec-TextCNN, Word2vec-BiLSTM, Word2vec-CRNN-Attention, Word2vec-BiLSTM-CNN, and Word2vec-BiLSTM-Attention.
All experiments were carried out using a single NVIDIA RTX3080 (16GB) GPU, which can also be replaced by commonly available multiple lower-tier GPUs such as GTX 1080. Researchers may also seek support from institutions in the field of computer science to access the necessary computational power. For baselines utilizing Word2Vec, we configured the batch size to 256 with a dropout rate of 0.5 to train the model with cross-entropy loss. We employed the Adam optimizer with an initial learning rate ranging from 1e-2 to 1e-5 and retained the model exhibiting the best performance. Specifically, the initial learning rate means the starting value used by the optimization algorithm (i.e., the Adam optimizer in this study) to control the step size during model training. The 1e-2 and 1e-5 represent the range of values for the learning rate, where 1e-2 is scientific notation for 0.01 and 1e-5 for 0.00001. Regarding BERT-based models, we followed Liu et al.’s (2023) process to determine parameters by first using a smaller batch size of eight to efficiently fit the model into GPU memory, and subsequently adopted Adam with a dropout probability of 0.1 to optimize the cross-entropy loss. Finally, we fine-tuned BERTs in five epochs with the learning rates of 3e-5 (i.e., 3 × 10⁻⁵) and 3e-6 (i.e., 3 × 10⁻⁶) and selected the former that demonstrated the highest F1-score through experimentation. Across all models, the hidden size was fixed at 256 for the recurrent modules, while the number of kernels was set to 256 for the convolutional modules.
To address RQ1, we assessed the effectiveness of models in categorizing topics within online course reviews. Before comparison, we partitioned the 9,996 annotated review sentences into the training and testing dataset. Specifically, 6,997 instances (70%) were assigned arbitrarily to the training dataset to train classifiers, and 2,999 instances (30%) constituted the testing dataset to gauge the model performance. In our experiments, we used four widely employed metrics: accuracy, precision, recall, and F1-score to assess classification performance.
To investigate RQ2, we employed the fine-tuned BERT-BiLSTM-Attention model to categorize 354,664 unlabelled review sentences according to predefined topic categories. Subsequently, we assessed the BERT-BiLSTM-Attention classifier’s performance using the four metrics and a confusion matrix to gain insights into its classification capabilities across different topic categories.
To investigate RQ3, we employed descriptive analysis and statistical modelling to examine how various review topic categories were distributed across different discipline domains and course rating groups. These analyses aimed to discern potential variations in learners’ review topics based on their academic disciplines and the overall course rating levels. Specifically, the low-star rating group consisted of courses with an overall star rating score of one or two, while the high-star rating group comprised courses with a rating score of four or five. Subsequently, a multivariate analysis of variance (MANOVA) was carried out to evaluate if notable variances existed in the frequency distributions of various topic categories between the low- and high-star rating groups.
The fine-tuned BERT-BiLSTM-Attention model’s performance was compared with 10 baseline methods. The results for these 11 models before fine-tuning are depicted in Table 1, while Table 2 illustrates their performance after fine-tuning. Overall, BERT-based models generally outperformed traditional Word2vec-based classification models in predicting MOOC review categories. Among the models before fine-tuning, those employing Word2vec-CRNN demonstrated the weakest performance across the four metrics. However, after fine-tuning, the Word2vec-CRNN-Attention model exhibited the lowest performance among all models. Focusing on the fine-tuned models, the BERT-BiLSTM-Attention model demonstrated superior predictive capability for categorizing learner-generated course evaluation text, achieving the highest F1 value of 0.7626 and recall value of 0.7578 compared to baseline models. Additionally, BERT-BiLSTM achieved the highest accuracy value of 0.8117, while BERT attained the highest precision value of 0.7843, representing slight improvements of 0.43% and 1.70%, respectively, over the BERT-BiLSTM-Attention model.
Table 1
Performance of BERT-BiLSTM-Attention Against Baselines Before Fine-Tuning as Measured by Accuracy, Recall, Precision, and F1-score
| Model | Accuracy | Recall | Precision | F1-score |
| Word2vec–CRNN | 0.5805 | 0.5805 | 0.5116 | 0.5202 |
| Word2vec–TextCNN | 0.6671 | 0.6671 | 0.6115 | 0.6243 |
| Word2vec–BiLSTM | 0.7400 | 0.7400 | 0.7369 | 0.7318 |
| Word2vec–CRNN–Attention | 0.6306 | 0.6306 | 0.5421 | 0.5745 |
| Word2vec–BiLSTM–CNN | 0.7253 | 0.7253 | 0.7110 | 0.7061 |
| Word2vec–BiLSTM–Attention | 0.7338 | 0.7338 | 0.7478 | 0.7294 |
| BERT | 0.8090 | 0.7441 | 0.7757 | 0.7572 |
| BERT–CNN | 0.8089 | 0.7407 | 0.7858 | 0.7589 |
| BERT–CNN–BiLSTM | 0.8037 | 0.7310 | 0.7671 | 0.7449 |
| BERT–BiLSTM | 0.8062 | 0.7385 | 0.7704 | 0.7488 |
| BERT–BiLSTM–Attention | 0.8053 | 0.7554 | 0.7681 | 0.7582 |
The training process involved multiple epochs to train the classifiers using the training dataset, followed by an assessment using the testing dataset. The training and testing loss, as well as accuracy values for the fine-tuned BERT, fine-tuned BERT-BiLSTM, and fine-tuned BERT-BiLSTM-Attention models, are depicted in Figure 4. All three models with the same Transformer structure showed comparable accuracies on the testing dataset.
Table 2
Performance of BERT-BiLSTM-Attention Against Baselines After Fine-Tuning as Measured by Accuracy, Recall, Precision, and F1-score
| Model | Accuracy | Recall | Precision | F1-score |
| Word2vec–CRNN | 0.6088 | 0.6088 | 0.6134 | 0.6099 |
| Word2vec–TextCNN | 0.6570 | 0.6570 | 0.6523 | 0.6513 |
| Word2vec–BiLSTM | 0.7334 | 0.7334 | 0.7306 | 0.7296 |
| Word2vec–CRNN–Attention | 0.5894 | 0.5894 | 0.5231 | 0.5380 |
| Word2vec–BiLSTM–CNN | 0.7225 | 0.7225 | 0.7336 | 0.7245 |
| Word2vec–BiLSTM–Attention | 0.7354 | 0.7354 | 0.7383 | 0.7335 |
| BERT | 0.8105 | 0.7440 | 0.7843 | 0.7591 |
| BERT–CNN | 0.8105 | 0.7420 | 0.7794 | 0.7535 |
| BERT–CNN–BiLSTM | 0.8025 | 0.7336 | 0.7593 | 0.7403 |
| BERT–BiLSTM | 0.8117 | 0.7538 | 0.7642 | 0.7561 |
| BERT–BiLSTM–Attention | 0.8082 | 0.7578 | 0.7712 | 0.7626 |
Note. Figures in bold indicate the highest values achieved for each evaluation metric.
By adding the BiLSTM and attention layers over BERT, the BERT-BiLSTM-Attention model yielded better robustness over BERT—the testing loss went up steadily at the early stage of the training, showing that it suffered less from overfitting. It is worth noting that BERT-BiLSTM-Attention achieved the highest F1-score but not the highest accuracy score, which may be explained by the fact that the dataset is highly skewed (as shown in Figure 2) with some categories having many more samples than others. F1-score measuring the model performance with imbalanced data indicated that BERT-BiLSTM-Attention could better handle the imbalanced data.
Figure 4
Comparing Training Loss, Testing Loss, and Accuracy of BERT, BERT-BiLSTM, and BERT-BiLSTM-Attention Models
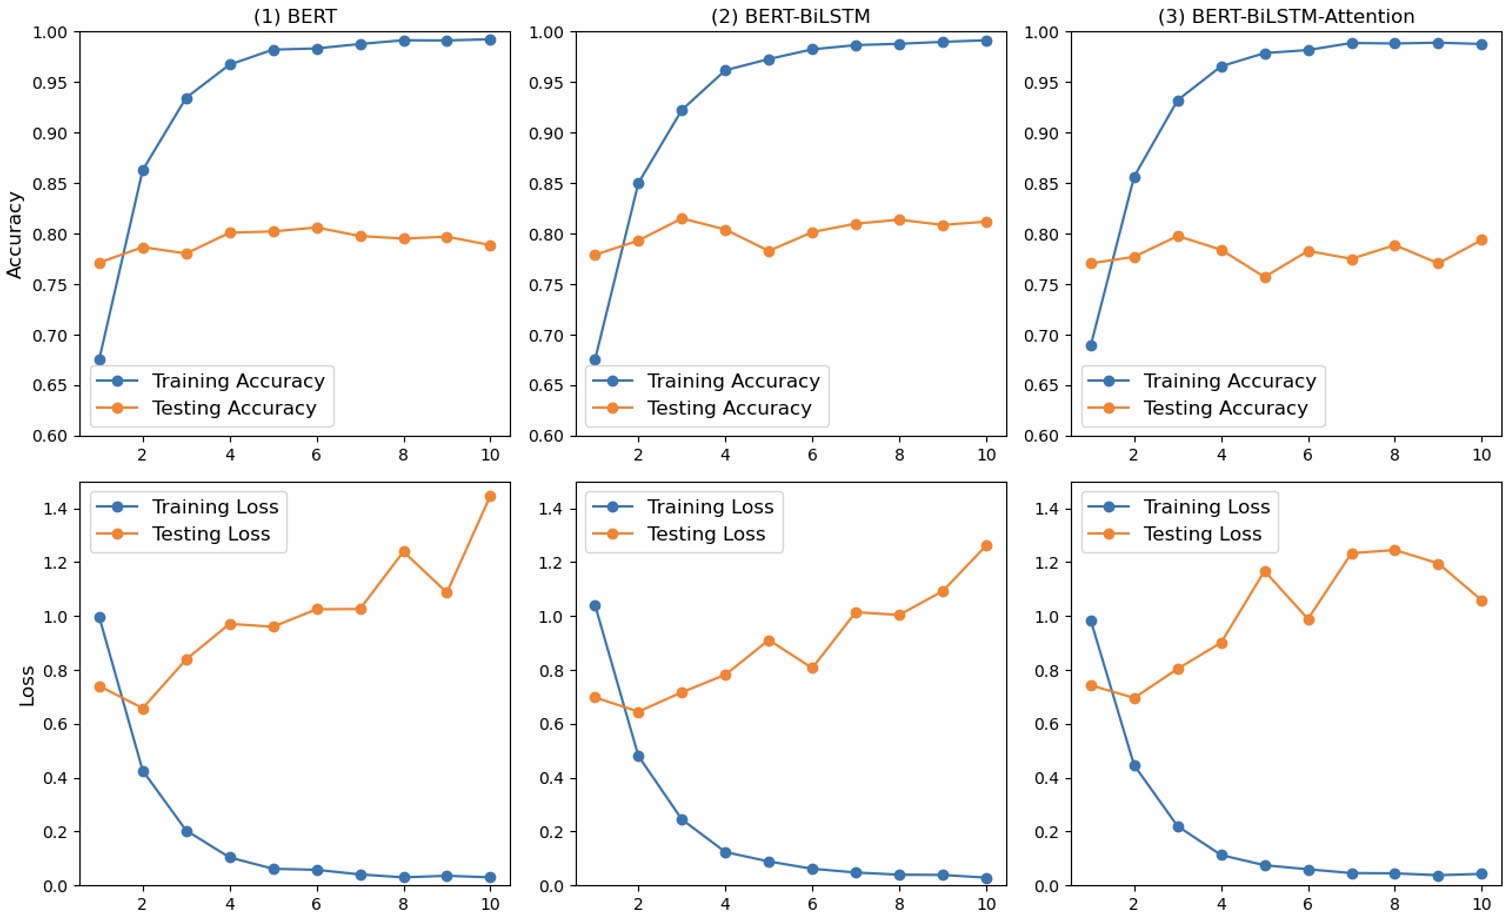
Table 3 displays the BERT-BiLSTM-Attention model’s performance across the nine review topic categories. Notably, precision values of 0.9264, 0.9005, and 0.8911 were achieved for the assessment, process, and instructor categories, respectively, positioning them as the top three in this metric. Regarding recall, the leading categories were instructor, learning resources, and overall evaluation, with values of 0.9317, 0.9130, and 0.8149, respectively.
Table 3
Performance of the Fine-Tuned BERT-BiLSTM-Attention Model Across Categories as Measured by Precision, Recall, and F1-score
| Category | Precision | Recall | F1-score |
| Platforms and tools | 0.7669 | 0.6818 | 0.7218 |
| Overall evaluation | 0.8697 | 0.8149 | 0.8414 |
| Course introduction | 0.6916 | 0.7158 | 0.7035 |
| Course quality | 0.7745 | 0.8093 | 0.7915 |
| Learning resources | 0.6213 | 0.9130 | 0.7394 |
| Instructor | 0.8911 | 0.9317 | 0.9110 |
| Learner | 0.5911 | 0.6268 | 0.6084 |
| Relationship | 0.5769 | 0.5000 | 0.5357 |
| Process | 0.9005 | 0.7037 | 0.7900 |
| Assessment | 0.9264 | 0.7910 | 0.8534 |
Regarding F1-scores, instructor, assessment, and overall evaluation took the lead with scores of 0.9110, 0.8534, and 0.8414, respectively. Notably, the instructor category exhibited the highest accuracy value of 93.17%. In summary, the BERT-BiLSTM-Attention model demonstrated effectiveness in distinguishing various categories within learner-generated course evaluation text, including instructor, learning resources, overall evaluation, and assessment. Nevertheless, it displayed relatively weaker performance in categories like learner and relationship.
To demonstrate the model’s performance across different categories, we created a confusion matrix specific to the BERT-BiLSTM-Attention classifier (see Figure 5). In this matrix, the x-axis donated predicted categories, and the y-axis indicated the actual categories.
Figure 5
Confusion Matrix for the Fine-Tuned BERT-BiLSTM-Attention Model
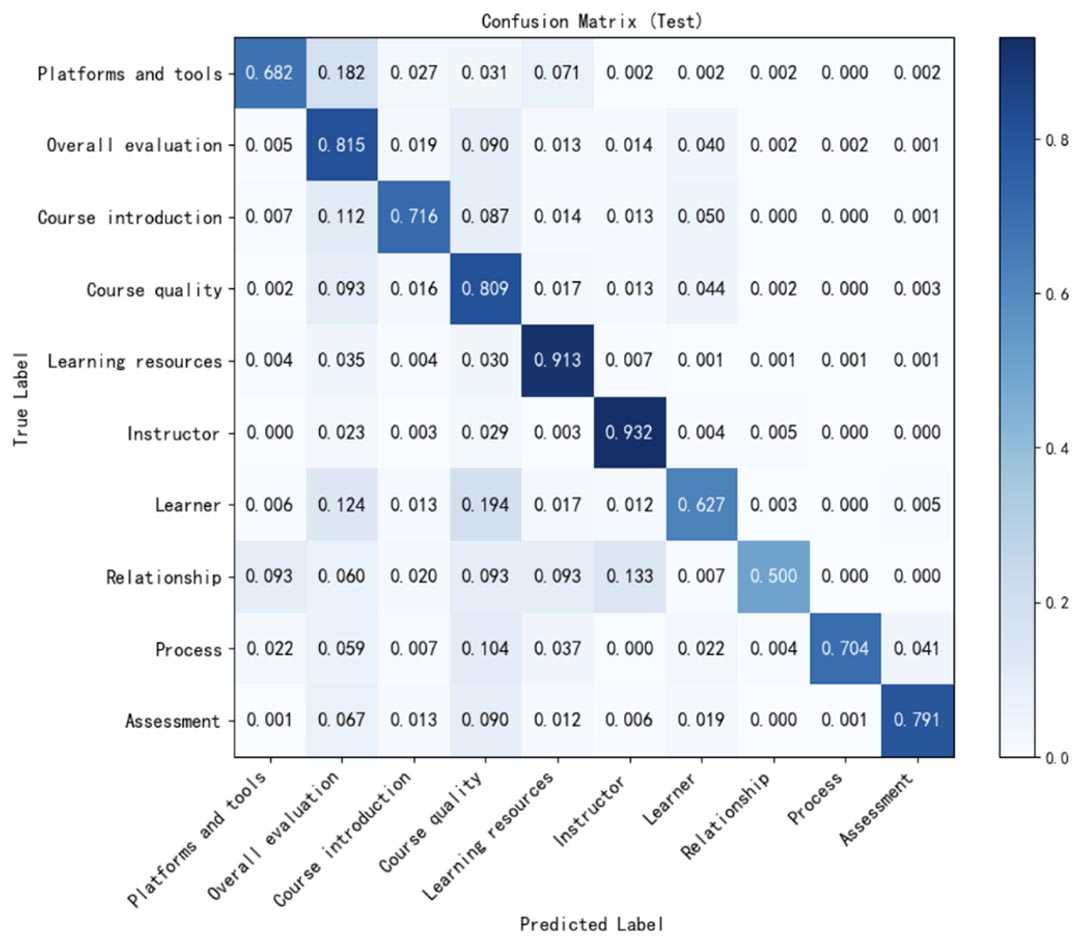
Notably, the instructor category presented the highest level of agreement between coders and classifier (0.932), followed by learning resources (0.913), overall evaluation (0.815), course quality (0.809), and assessment (0.791), all demonstrating a reasonable level of consistency. However, the agreement for categories like relationship, learner, and platforms and tools was lower, with these categories being frequently mispredicted as instructor, course quality, and overall evaluation. Specifically, for the relationship category, 13.3% of the records were incorrectly labelled as instructor. Similarly, 19.4% of the learner records were misclassified as course quality, and 12.4% were erroneously categorized as overall evaluation. Additionally, for the platforms and tools category, 18.2% of the records were mispredicted as overall evaluation.
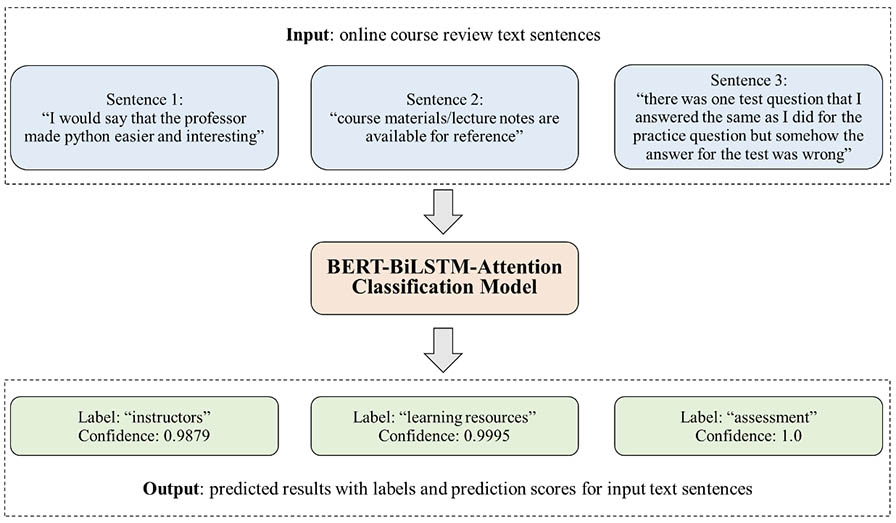
After completing model training, the fine-tuned BERT-BiLSTM-Attention model was used to categorize 354,664 unlabelled course evaluation texts generated by MOOC learners. Figure 6 illustrates this process by displaying examples of the model’s automated classifications. The trained model received three examples of learner-generated course evaluation texts as input to evaluate their semantic content based on prior learning from the training dataset. Subsequently, it generated predictions automatically, providing both the predicted category as well as its confidence level. When analysing the review sentence “I would say that the professor made Python easier and interesting”, the model categorized it under the instructor category with the highest confidence value of 0.9879.
Figure 6
Examples of the Automatic Classification of Course Reviews by the Fine-Tuned BERT-BiLSTM-Attention Model
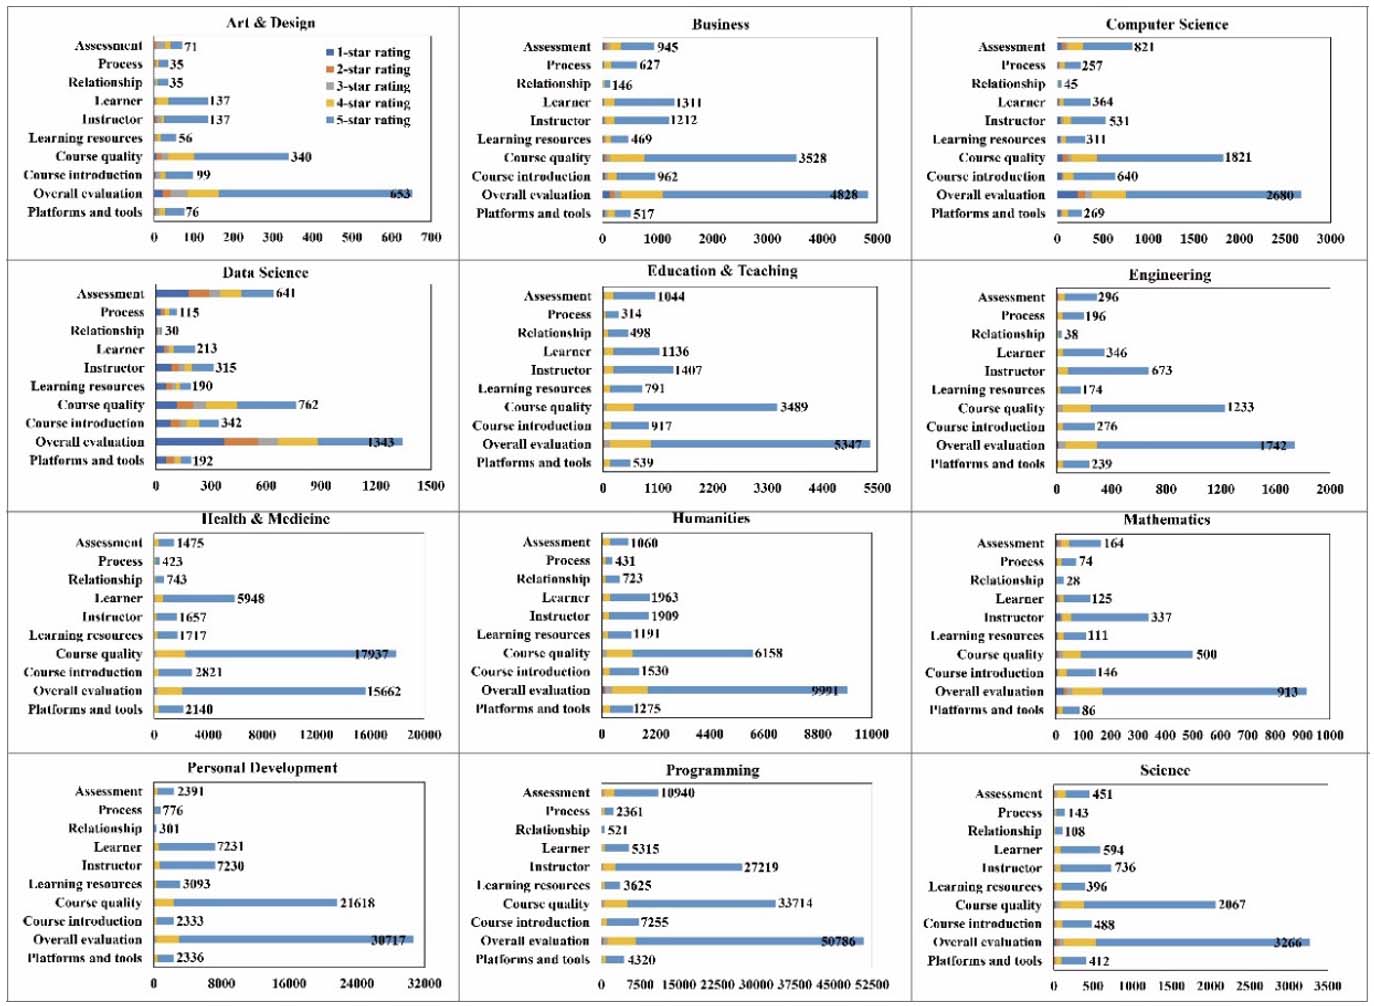
Using the fine-tuned BERT-BiLSTM-Attention model, this study automated the categorization of all review sentences provided by MOOC learners. The distribution of each topic category across 12 different discipline domains is presented in Figure 7. In 11 out of the 12 disciplines, excluding health and medicine MOOCs, the most frequently mentioned topic by learners in their reviews was overall evaluation, followed by course quality. In computer science, data science, and programming MOOCs, the category of assessment ranked as the topic mentioned third most often, with instances of 821, 641, and 10,940, respectively. Across all domains, the categories of process and relationship were seldom mentioned.
Figure 7
Number of Course Reviews for Different Topic Categories Across Discipline Domains
It was essential to investigate potential disparities in the occurrence of topic categories among MOOC courses rated as high and low to offer valuable insights into strategies for decreasing MOOC dropout rates. Therefore, a MANOVA analysis was performed to examine if the frequencies of topic categories differed depending on course star ratings. The findings of this analysis are detailed in Table 4.
The Box’s M test (χ2 (55, n = 85718) = 7794.596, p < 0.01) revealed a significant result, indicating unequal covariance values across groups. Subsequently, Pillai’s Trace statistic was employed, revealing a significant MANOVA effect (Pillai’s Trace = 0.023545, F (1, 85718) = 206.66, p < 0.01). This suggested statistically significant differences among various course rating groups regarding dependent variables. Following this, univariate tests were conducted, showing significant differences among courses with different star ratings in all categories except relationship (F (1, 85,718) = 0.161, p = 0.688).
Table 4
Result of MANOVA Analysis
| Category | High-rating | Low-rating | Univariate test | ||||
| Mean | SD | Mean | SD | F | η2 | Sig. | |
| Platforms and tools | 0.113 | 0.001 | 0.329 | 0.023 | 342*** | 0.040 | 0.000 |
| Overall evaluation | 1.26 | 0.004 | 1.82 | 0.051 | 191*** | 0.020 | 0.000 |
| Course introduction | 0.173 | 0.001 | 0.389 | 0.024 | 237*** | 0.030 | 0.000 |
| Course quality | 0.936 | 0.003 | 0.754 | 0.031 | 39.7*** | 0.000 | 0.000 |
| Learning resources | 0.117 | 0.001 | 0.262 | 0.02 | 150*** | 0.002 | 0.000 |
| Instructor | 0.454 | 0.002 | 0.398 | 0.023 | 6.62** | 0.000 | 0.01 |
| Learner | 0.254 | 0.002 | 0.204 | 0.017 | 8.03** | 0.000 | 0.005 |
| Relationship | 0.032 | 0.001 | 0.029 | 0.005 | 0.161 | 0.000 | 0.688 |
| Process | 0.051 | 0.001 | 0.175 | 0.015 | 261*** | 0.003 | 0.000 |
| Assessment | 0.177 | 0.002 | 0.705 | 0.034 | 1,254*** | 0.014 | 0.000 |
Note. ***: p < 0.001; **: p < 0.01; *: p < 0.05.
Comparing mean values between high- and low-rating courses across nine topic categories revealed that high-rating courses exhibited higher frequency scores in course quality, instructor, and learner categories compared to low-rating ones. Low-rating courses showed higher frequency scores in platforms and tools, overall evaluation, course introduction, learning resources, process, and assessment categories compared to high-rating ones. However, the MANOVA analysis results also revealed no significant differences among various course rating groups regarding relationship (p > 0.05).
Based on a manually annotated dataset comprising 9,996 course review sentences collected from Class Central, this study proposed and assessed the feasibility of classification models for automatically classifying reviews into 10 topic categories identified within the dataset.
A BERT-BiLSTM-Attention model was proposed and fine-tuned for the automated classification of 10 topic categories. The outcomes revealed that the BERT-based models generally performed better than did traditional Word2vec-based models, consistent with previous studies on MOOC classification (e.g., El-Rashidy et al., 2023; Liu et al., 2023). For example, Liu et al. (2023) reported the outperformance of a MOOC-BERT model compared to machine learning and deep learning models like SVM and TextRNN in identifying learners’ cognitive presence from large-scale MOOC discussion data. Similarly, El-Rashidy et al. (2023) reported that a higher accuracy value was achieved by combining BERT and multi-CNNs for MOOC post classification compared to BiGRU and BiLSTM. BERT-based models’ superiority could be explained by their deep contextual understanding and ability to be fine-tuned on specific tasks, allowing them to capture the nuances of language effectively and adapt to various applications (Wulff et al., 2023).
In particular, this study highlighted the outperformance of the fine-tuned BERT-BiLSTM-Attention model that combined the strengths of each component, compared to other BERT- and Word2vec-based models in classifying review topics. Specifically, the proposed model exploited BERT’s contextual embeddings and generalization ability across diverse texts to capture bidirectional context, while addressing its weakness in dealing with long-range dependencies. We used BiLSTM’s sequential processing power to effectively manage sequential data and maintain context longer sentences, coupled with attention mechanism’s capacity to prioritize important information. This led to richer and more nuanced feature representation and finally higher classification accuracy and scalability.
The level of agreement between human annotators and the machine varied across different categories. Categories like overall evaluation, course quality, learning resources, and instructor exhibited high consistency (up to 0.80), whereas categories like learner and relationship showed lower levels of agreement (below 0.60). This discrepancy could be attributed to the data distribution, as categories showing better performance had significantly more instances compared to those with poorer performance. When it came to automatic classification, some categories were more straightforward for the fine-tuned BERT-BiLSTM-Attention model to identify and differentiate. For instance, the category instructor was relatively easy to identify due to the presence of distinct keywords (e.g., teacher, tutor), allowing the automatic model to assign reviews accordingly. For the review sentence “The teacher not only knows his materials but has a lot of experience working with first-time programming,” the model could easily detect teacher and predict it as instructor accordingly.
Conversely, categories like learner and relationship were less discernible to the fine-tuned BERT-BiLSTM-Attention model and were prone to misclassification. For example, review sentences such as “I had only grabbed a basic feel of programming and patron using Codecademy right before enrolment of this class” and “The discussion groups were helpful and suppurative with the interaction between students and lecturer” belonged to categories learner and relationship, respectively. The model, however, mispredicted them as course quality and instructor. Such reviews often lack explicit keywords, requiring the model to consider multiple sentences or even entire passages in order to grasp their meanings. Additionally, the linguistic features and semantic expressions associated with these categories often overlap, posing challenges even for human annotators. Addressing these issues may require involving linguists to implement advanced linguistic analysis techniques like named entity recognition and part-of-speech tagging to more effectively parse the nuanced expressions and contextual meanings in order to improve model performance. Presently, we have involved domain experts to review and revaluate reviews exhibiting low F1-scores to make corrections.
The fine-tuned BERT-BiLSTM-Attention model was used to automatically code unlabelled data. This automatically coded data was then combined with previously coded data to identify the frequency distribution of review topic categories across disciplines. Corroborating with Chen et al. (2024), we found a large number of reviews related to overall evaluation, suggesting that instead of merely commenting on detailed aspects, learners tended to show overall perceptions within their comments. We also identified a high frequency of course quality while there were low frequencies of process and relationship, which could be explained by learners’ low expectations and lack of willingness to interact with instructors due to unfamiliarity (Hew et al., 2020).
Variations were identified when topic distributions in different disciplines were compared. For example, learners engaged in technological courses, such as computer science, data science, and programming, exhibited high levels of engagement with assessment-related issues compared to learners in other disciplines, suggesting that these learners perceived evaluation as a critical component in the process of learning complex technical content (Qaddumi et al., 2021). Thus, instructors ought to tailor assessment design and feedback mechanisms to ensure their alignment with learning objectives and to support learners’ skill development in technological disciplines (Conrad & Openo, 2018).
The significant differences in the frequencies of topic categories between high- and low-rating courses revealed by MANOVA analysis provided valuable insights into influential factors for learner satisfaction. Specifically, learners in high-rating courses more frequently mentioned issues related to course quality, instructor, and learner compared to those in low-rating courses, highlighting the importance of these factors in shaping learners’ perceptions and satisfaction. According to Yousef and Sumner (2021), high-quality course content, effective instruction, and supportive learning communities contributed to positive learning experiences; thus, MOOC instructors and designers should enhance course quality, improve instructor support, and create positive atmospheres to effectively bolster online learning effectiveness and improve learning outcomes and satisfaction.
For low-rating courses, our analysis revealed significantly higher frequencies of platforms and tools, overall evaluation, course introduction, learning resources, process, and assessment than for high-rating courses. According to previous studies (e.g., Alario-Hoyos et al., 2017; Chen et al., 2024; Hew et al., 2020), (a) functional and usable platforms and tools, (b) clear and effective course introductions, (c) the availability and quality of learning resources and problem-solving support, and (d) transparent fair assessment contributed significantly to MOOC learners’ overall satisfaction. Thus, MOOC instructors and designers should pay attention to improving platform functionality, instructional clarity, resource accessibility, and assessment fairness to promote learning outcomes and learner satisfaction.
The fine-tuned BERT-BiLSTM model demonstrated a slightly higher accuracy value of 0.8117 compared to the fine-tuned BERT-BiLSTM-Attention model, suggesting that fine-tuned BERT-BiLSTM had a marginally better ability to classify review topics correctly. Instructors who seek a trustworthy foundation for decision-making, could adopt the fine-tuned BERT-BiLSTM model, as the highest-accuracy model. Looking at the F1-score, the fine-tuned BERT-BiLSTM-Attention model outperformed baselines with a highest value of 0.762 in correctly identifying true positives while minimizing both false positives and false negatives. Thus, instructors who wish to capture all pertinent instances of relevant feedback without including irrelevant data would find the fine-tuned BERT-BiLSTM-Attention model, as the highest F1-score model, preferable.
Regarding classification across topic categories, the fine-tuned BERT-BiLSTM-Attention model showed high values for categories such as instructor” (0.9110) and assessment (0.8534), meaning that the model was highly effective in capturing nuanced feedback about these aspects, thus providing a reliable foundation for subsequent analysis. According to Chen et al. (2024), a model that classified the semantic content into appropriate categories was crucial for large-scale studies—such as rapidly exploring the relationship between categories and variables like sentiments to quickly reveal areas for improvement. Thus, for instructors who want to improve learner experience through instructor improvement and assessment design, the fine-tuned BERT-BiLSTM-Attention model, proficient in correctly categorizing relevant reviews, would be preferable.
Although the fine-tuned BERT-BiLSTM-Attention model outperformed baselines in classifying course review topics, implementing it is computationally intensive; future work may consider reducing model complexity and optimizing the training process through pruning and transfer learning. In determining hyperparameters, we referred to prior studies alongside initial experiments to balance performance and computational efficiency; however, improvements in model configuration could be considered in future work by evaluating different hyperparameters’ effects on classification performance.
In measuring model performance and analysing topic distributions across disciplines and course rating groups, we used quantitative metrics and statistical approaches as they were capable of processing and analysing large-scale review data efficiently while reducing potential subjective bias. However, future work could incorporate qualitative analysis of sampled data to validate the results or complement with surveys or interviews to collect data on additional variables like course difficulty. This would provide a comprehensive understanding of MOOC learner satisfaction.
Regarding the dataset, the course reviews used in this study might contain learners’ varying attitudes towards different topics and aspects; however, our analysis and results were independent of learners’ sentiments. This is because our focus on identifying the semantic content within reviews relied mainly on the topic aspect-related terms (e.g., instructor, assessment) rather than words expressing sentiment. Furthermore, due to class imbalance (e.g., overall evaluation made up 35.54% while relationship just 0.90%), there were discrepancies in model performance across topic categories. Future work might augment the data to expand the training data for low-proportion categories to improve classification. Finally, we collected data from Class Central only; future work might include MOOC data from different platforms (e.g., Coursera) to validate our findings.
This study examined the efficacy of fine-tuned BERTs for classifying the semantic content of MOOC course reviews and investigated review topics’ variations across disciplines and course rating groups. Results showed that fine-tuned BERTs generally outperformed Word2vec- and BERT-based models in predicting review categories, with the fine-tuned BERT-BiLSTM-Attention model demonstrating the highest F1-score and recall values of 0.7626 and 0.7578, especially for categories such as process, assessment, overall evaluation, and instructor (up to 0.80 accuracy). The distribution analysis highlighted differences in learners’ concerns across disciplines; for example, learners in technical fields exhibited high engagement with assessment-related issues. The MANOVA results revealed significant differences in each topic category between courses in the high- and low-rating groups. Comparing the mean scores demonstrated better performance of high-rating courses in terms of course quality and instructor compared to low-rating courses.
The implications of this study were summarized in terms of five aspects. First, instructors can exploit the proposed methodologies that combine automatic classification and statistical modelling to monitor MOOC learners’ needs and use data-driven insights for course improvements. Second, instructors should tailor course content and assessment methods to meet learners’ needs in different disciplines. For example, for technical courses, robust assessment tools can be developed and updated to ensure fairness and clarity, and provide detailed feedback that addresses learners’ queries. Third, given instructor performance’s importance in high-rating courses, instructors should be provided with targeted training and resources to enhance learner engagement and achieve MOOC success. Furthermore, researchers should further improve the automatic models by involving education and AI experts familiar with both MOOC instruction and AI technologies to address underperforming categories like relationship and learner. Finally, as learners’ needs may change over time, MOOC developers should consider designing tools for real-time analytics that combine automatic classification and statistical modelling with variables like time and learner characteristics. This approach would constantly trace learners’ experiences and their perceptions of MOOCs.
The authors declare that they have no conflicts of interest to report regarding the present study.
This work was supported by the National Natural Science Foundation of China (No. 62307010) and the Philosophy and Social Science Planning Project of Guangdong Province of China (Grant No. GD24XJY17).
Alario-Hoyos, C., Estévez-Ayres, I., Pérez-Sanagustín, M., Delgado Kloos, C., & Fernández-Panadero, C. (2017). Understanding learners’ motivation and learning strategies in MOOCs. International Review of Research in Open and Distributed Learning, 18(3), 119-137. https://doi.org/10.19173/irrodl.v18i3.2996
Cavalcanti, A. P., Diego, A., Mello, R. F., Mangaroska, K., Nascimento, A., Freitas, F., & Gašević, D. (2020, March). How good is my feedback? A content analysis of written feedback. In Proceedings of the 10th International Conference on Learning Analytics & Knowledge (pp. 428-437). https://doi.org/10.1145/3375462.3375477
Cavalcanti, A. P., Mello, R. F., Gašević, D., & Freitas, F. (2023). Towards explainable prediction feedback messages using BERT. International Journal of Artificial Intelligence in Education, 34, 1046-1071. https://doi.org/10.1007/s40593-023-00375-w
Chen, X., Zou, D., Cheng, G., & Xie, H. (2024). Deep neural networks for the automatic understanding of the semantic content of online course reviews. Education and Information Technologies, 29(4), 3953-3991. https://doi.org/10.1007/s10639-023-11980-6
Conrad, D., & Openo, J. (2018). Assessment strategies for online learning: Engagement and authenticity. Athabasca University Press. https://doi.org/10.15215/aupress/9781771992329.01
El-Rashidy, M. A., Farouk, A., El-Fishawy, N. A., Aslan, H. K., & Khodeir, N. A. (2023). New weighted BERT features and multi-CNN models to enhance the performance of MOOC posts classification. Neural Computing and Applications, 35(24), 18019-18033. https://doi.org/10.1007/s00521-023-08673-z
Hew, K. F. (2016). Promoting engagement in online courses: What strategies can we learn from three highly rated MOOCS. British Journal of Educational Technology, 47(2), 320-341. https://doi.org/10.1111/bjet.12235
Hew, K. F., Hu, X., Qiao, C., & Tang, Y. (2020). What predicts student satisfaction with MOOCs: A gradient boosting trees supervised machine learning and sentiment analysis approach. Computers & Education, 145, 103724. https://doi.org/10.1016/j.compedu.2019.103724
Li, L., Johnson, J., Aarhus, W., & Shah, D. (2022). Key factors in MOOC pedagogy based on NLP sentiment analysis of learner reviews: What makes a hit. Computers & Education, 176, 104354. https://doi.org/10.1016/j.compedu.2021.104354
Liu, Z., Kong, X., Chen, H., Liu, S., & Yang, Z. (2023). MOOC-BERT: Automatically identifying learner cognitive presence from MOOC discussion data. IEEE Transactions on Learning Technologies, 16(4), 528-542. https://doi.org/10.1109/TLT.2023.3240715
Moore, M. G. (2013). The theory of transactional distance. In Moore, M. G. (Eds.) Handbook of distance education (pp. 66-85). Routledge. https://doi.org/10.4324/9780203803738
Qaddumi, H., Bartram, B., & Qashmar, A. L. (2021). Evaluating the impact of ICT on teaching and learning: A study of Palestinian students’ and teachers’ perceptions. Education and Information Technologies, 26(2), 1865-1876. https://doi.org/10.1007/s10639-020-10339-5
Sebbaq, H., & El Faddouli, N. (2022). Fine-tuned BERT model for large scale and cognitive classification of MOOCs. International Review of Research in Open and Distributed Learning, 23(2), 170-190. https://doi.org/10.19173/irrodl.v23i2.6023
Wulff, P., Mientus, L., Nowak, A., & Borowski, A. (2023). Utilizing a pretrained language model (BERT) to classify preservice physics teachers’ written reflections. International Journal of Artificial Intelligence in Education, 33(3), 439-466. https://doi.org/10.1007/s40593-022-00290-6
Yousef, A. M. F., & Sumner, T. (2021). Reflections on the last decade of MOOC research. Computer Applications in Engineering Education, 29(4), 648-665. https://doi.org/10.1002/cae.22334
Table A1
Coding Scheme
| Category | Description |
| Course introduction | Course information (e.g., syllabus, overview, schedule/calendar, requirement, certificate, credential, payment, language) |
| Course quality | Content and information quality, course difficulty, knowledge enhancement, beginner friendliness, practicality, usefulness, helpfulness |
| Learning resources | Availability of learning materials, textbooks, notes, handouts, slides |
| Instructor | Instructor knowledge, accessibility, enthusiasm for teaching, humour, presentation, pace of instruction |
| Learner | Learner background, leaner interest, educational needs (e.g., job or academic needs) |
| Relationship | Peer interaction, learner-instructor interaction |
| Assessment | Quizzes, assignments, projects, exercises, tests, experiments, lab activities, grading |
| Process | Giving and receiving feedback, participating in learning activities, problem-solving, availability of cases and examples during learning |
| Platforms and tools | Platform use, system quality, and video quality (e.g., captions, transcripts, speed, image, sound) |
| Others | Learner perception, overall evaluation, appreciation, recommendation |

Automatic Classification of Online Learner Reviews Via Fine-Tuned BERTs by Xieling Chen, Di Zou, Haoran Xie, Gary Cheng, Zongxi Li, and Fu Lee Wang is licensed under a Creative Commons Attribution 4.0 International License.