Volume 22, Number 1
Dr. Gopal Datt1 and Dr. Gagan Singh2
1School of Vocational Studies, Uttarakhand Open University, Haldwani, India, 2School of Management Studies & Commerce, Uttarakhand Open University, Haldwani, India
This paper explores learners’ awareness of and satisfaction with the e-services that an open university provides its learners through its Website. The paper further highlights the influence of age, gender, and education levels on learners’ awareness and satisfaction levels. A case-study approach was adopted and an online survey was used to collect data from learners in various programs of study at Uttarakhand Open University, India. The questionnaire measured the awareness levels of learners regarding 15 frequently used e-services and their satisfaction levels with the 12 most frequently used e-services that the university offers. Results show that gender, age, and education level have a significant influence on the awareness and satisfaction level of the participants. When maturity level and education level of the participants increased, they are more aware of the e-services provided by the University. In some cases, up to 58% of users were unaware of the university’s e-services, and a large number of respondents were either dissatisfied with or undecided regarding the university’s e-services. Results indicate that infrastructure is required for learners’ optimal use of information and communication technology and the e-services that the university offers, including the provision of Internet connectivity at all of the university’s learning support centers.
Keywords: e-services, Website, open and distance education, ODE, learner satisfaction, open university
The Website of any open university is the most common medium for distributing information among current and prospective learners. The use and importance of Websites is increasing with the global reach of the Internet. In the open and distance learning (ODL) approach to education, in contrast to conventional or traditional methods, learners and the teachers are geographically separated; and learners must learn independently, using information and communication technology (ICT; Sahusilawane & Hiariey, 2016). The Website of any ODL institution plays an important role in bridging this gap. The university Website is an information gateway for its users. Open university Websites are more advanced than the Websites of other educational institutions because the open university Website acts as a one-stop resource through which several learner support services are launched, such as online admissions; notices and announcements; student records; online examination forms; e-learning portals; evaluation results; and complaint, query, and grievance registration. This study aimed to identify open university learners’ awareness of and satisfaction with the e-services that the university provides through its Website.
The Internet has made access to information and the distribution of educational content available to a large portion of the world’s population. It has also helped move distance education into the digital era (Fidalgo et al., 2020). ODL has become an integral part of the teaching-learning process in higher education. e-Learning is becoming a popular medium because of its efficiency in providing education at lower costs and with easy access at any time and anywhere. In the ODL system, educational opportunities are deliberately planned so that education is available to large parts of society and can reach the remotest locations of a region. This system also helps overcome many of the problems involved in the traditional education system, such as a lack of classrooms, lack of quality education, and faculty shortages, among others. The ODL system is an opportunity for learners who are unable to join traditional classrooms for a variety of reasons and has great potential to increase the inclusivity of education because of its flexibility and distinctive user-friendly character. Furthermore, education prepares learners to be more productive and competent in the harsh competition of the global economy; and the ODL system can serve as a platform to pursue new levels of qualification and enhance learners’ skillset and knowledge.
Table 1
Total Number of Individual Internet Users Worldwide (2001-2018)
| Year | Internet users (in millions) | Internet users per 100 inhabitants |
| 2001 | 495 | 8.0 |
| 2002 | 677 | 11.0 |
| 2003 | 785 | 12.0 |
| 2004 | 914 | 14.0 |
| 2005 | 1,100 | 16.8 |
| 2006 | 1,216 | 18.4 |
| 2007 | 1,382 | 20.6 |
| 2008 | 1,570 | 23.1 |
| 2009 | 1,772 | 25.8 |
| 2010 | 2,035 | 29.3 |
| 2011 | 2,242 | 31.8 |
| 2012 | 2,478 | 34.8 |
| 2013 | 2,669 | 37.0 |
| 2014 | 2,853 | 39.1 |
| 2015 | 3,060 | 41.5 |
| 2016 | 3,345 | 44.8 |
| 2017 | 3,701 | 49.0 |
| 2018 | 3,924 | 51.4 |
Note. Based on data from the International Telecommunication Union (https://www.itu.int/en/ITU-D/Statistics/Pages/default.aspx)
Table 1 presents the number of individual Internet users worldwide (in millions) and individual Internet users per 100 inhabitants from 2001 to 2018. As the table shows, there has been significant growth in the number of Internet users in the past 18 years. In the 21st century, digital presence and e-services are key to achieving success. The Internet, in its diverse forms and features (e.g., accessibility, availability, and popularity) plays a central role in many businesses worldwide, and the importance of online presence is significant. Most higher education institutions have a notable Web presence; and information related to courses, prospective students, news and events, and other topics can be easily accessed by visitors to the Website (Manzoor et al., 2012). The Web-based visibility of an ODL institution has several advantages over physical or local visibility, because the accessibility of services is central to the ODL approach. In addition, social media performs a key role in popularizing social organizations and even academic relations in educational institutions (Permatasari et al., 2013).
The Internet is a prominent medium that ensures the instant delivery of information to target audiences. The Web-based information delivery system facilitates various innovative methods for teaching, learning, and managing administrative records and drives competition among ODL organizations in terms of the e-services they provide through the Internet.
In 21st century education, the role of ODL has changed. A paradigm shift has occurred because of the unprecedented development of Web-based technologies, especially the advancements in computer-based teaching and learning and instant information delivery and communications (e.g., virtual classes, forums, and online learning, as well as video and audio archives, and e-content). In this context, the Website of any educational institution is a key resource for prospective learners to learn about the institution and prepare themselves accordingly and for learners enrolled in the institution to access the information and services they need to succeed. Satisfaction with these services from the viewpoint of their users is key for any organization. Identifying learners’ satisfaction with the performance and usability of the university’s e-services can help universities improve their offerings over time (Islam & Tsuji, 2011).
According to the guidelines of the Distance Education Bureau in India, in order to provide effective student support services and quality education, ODL institutions should have a dedicated Website for its ODL system, regularly update its technology, and introduce new technological innovations (Distance Education Council, 2009). The ideal Website of an ODL institution, and the e-services provided through it, is a reflection of current and prospective learners’ needs. However, Website design is often driven by available technology and business objectives, though usability is gradually gaining in importance. There are several methods to assess the usability of Websites, such as heuristic methods, prototyping, cognitive walkthroughs, and questionnaires, among others (Mustafa & Al-Zoua’bi, 2008). Website usability can also be studied from different perspectives and different usability assessment tools can be used. Website designers and developers can use the results of such assessments to improve the Website (Chiew & Salim, 2003).
Numerous studies have been conducted on the usability of the Websites of higher education institutions. These studies conclude that university Websites should include relevant content for users, be maintainable, have an efficient structure, and provide contact information, among other features (Islam & Tsuji, 2011; Mentes & Turan, 2012; Roy, Pattnaik, & Mall, 2014, and Jabar, Usman, & Awal, 2013). Islam and Tsuji (2011), in their study of the usability select university Websites in Bangladesh, found that the overall usability of the Websites was unsatisfactory; though a few of the Websites were satisfactory in terms of the available features (e.g., educational information and user interface design). Among the weaknesses found were poor structural design and interface and performance issues. In a study of the usability of Namik Kemal University’s Website in Turkey, Mentes and Turan (2012) used the Website analysis and measurement inventory (WAMMI), which measures Website usefulness and its ease of access. WAMMI is based on five factors: attractiveness, controllability, efficiency, helpfulness, and learnability (Mentes & Turan, 2012). It has been concluded in the study that the website is having key role in establishing a healthy communication between the university and its stakeholders.
Other studies have focused on usability from a user’s perspective. Jabar et al. (2013) explored the perspectives of 364 university learners on the usability of university Websites and investigated whether the learners’ areas of specialization had impact on the perceived usability of the Websites. They concluded that usability factors (i.e., attractiveness, controllability, helpfulness, efficiency, and learnability) must be given more consideration when designing educational Websites. In a quantitative study of the usability of academic Websites from a user perspective, Roy et al. (2014) employed both questionnaire- and performance-based methods. Participants were asked to perform a task on a university Website and then complete a questionnaire. Data was collected on observed task success rates and task completion times, as well as participants’ post-task satisfaction levels and their feedback on the Website’s usability. The impact of task completion times on participant’s satisfaction levels was also explored. This study shows that the multiple language supports in sharing information and less response time are the effective usability factors which satisfy its users (Roy, Pattnaik, & Mall, 2014). Hasan’s (2014) study on the usability of educational Websites based on student design preferences found that learners preferred design category was Website content followed by navigation, while organization was considered the least important to them. It is important to note that there was a statistically significant difference between male and female students regarding the Website content and its navigation. In another study, Undu and Akuma (2018) investigated the usability of the Benue State University Website from a users’ perspective. The university Website is used to communicate with learners and offers computing services. Undu and Akuma concluded that the university Website had a neutral usability level because of the usability issues found in the study. Inconsistence in design and layout of web pages, dismay with the website navigation, controllability, and inappropriate labelling of the navigation menu are some of the usability issues found in the study.
Garett et al. (2016), in their review of literature on Website design and user engagement, identified eight key elements of effective Website design, including navigation, graphical representation, organization, content utility, purpose, simplicity, and readability. Garett et al. also suggest that before designing a Website, one should decide on the priorities and objectives of the Website based on its field. For example, a Website related to online business seeks to optimize brand, loyalty, profit, and smooth and fast page loading; while an academic Website seeks content accuracy, privacy, publicity for academic achievements and success, and availability of important information for prospective users. To develop an attractive and interactive Website for an academic institution, structural planning, quality content, and useful information for potential users are key factors. Keyword search and navigation links or menus are in high demand among users of the academic institution Website (Raduica et al., 2019).
Various studies have been conducted to identify and assess the perceptions of learners on e-learning and the performance of online services that ODL institutions offer their learners. The review of literature conducted for this study revealed that most studies on the use of ICTs or ICT interventions in ODL were conducted before the COVID-19 pandemic. Learner satisfaction with the performance of ODL institution Websites has yet to be studied during the COVID-19 pandemic, when the role of ICTs in disseminating knowledge through e-learning has become a necessity. This study addressed the research gap by conducting this study during the COVID-19 pandemic. Due to the lockdown across the country, people everywhere are required to stay at home. In situations like this, the use of ICT plays a key role in disseminating knowledge and information amongst its seekers. Therefore, we conducted this study to explore learner satisfaction with the website performance of an open and distance learning institution during this period of time. We investigated both the opportunities available to and challenges faced by users of ICT during the COVID-19 pandemic. The results of this study will assist policy makers and the various service providers who offer services through ICT. We explored learner satisfaction with the performance of an ODL university’s Website in India during the COVID-19 pandemic, in terms of the e-services that the university provides through the Website and the Website’s visibility. The study also investigated learners’ perceptions of the usability of the Website and the e-services, which include information about the university, links to admission processes, counselling session scheduling, examination forms and announcements of results, access to transcripts and degree certificates, and learner grievance procedures, among other services. Suggested measures to improve and enhance the usability of the university Website are made based on the study results. The results of this study may be useful to distance education institutions or universities that offer their programs of study through ICTs, especially during a crisis, such as the COVID-19 pandemic.
Employing a case-study approach, this study was conducted at Uttarakhand Open University in India and assessed learners’ satisfaction with the performance of the university’s Website and e-services, their awareness of the university’s e-services, and their perception of the Website’s usability. Data was collected from primary as well as secondary sources. Primary data was collected from learners enrolled in the Uttarakhand Open University using an online survey questionnaire; and secondary data was collected from relevant literature and Websites, publications, reports and records from the International Telecommunication Union (ITU), the Uttarakhand Open University, distance education institutes, the University Grants Commission, the Ministry of Human Resource Development, the Distance Education Council, and the Distance Education Bureau in India. All data were statistically analyzed. Learners’ awareness of and satisfaction with the university’s e-services were analyzed based on gender, age, and education levels.
An online questionnaire was used to collect data from learners at Uttarakhand Open University. The questionnaire comprised 36 questions and was organized in three sections: The first section focused on general demographic information, including participants gender, age group, highest level of education, occupation, and employment status and the devices used to access the university Website. The second section included questions about the learners’ awareness of 15 frequently used e-services that the university provides, to which participants responded “yes” or “no.” The third section included questions about learners’ satisfaction with the 12 most frequently used e-services, to which participants responded using a five-point Likert scale.
The questionnaire was sent via e-mail, WhatsApp, and other social media platforms (i.e., departmental blogs, University website, Facebook, and University e-learning platforms) to more than 220 potential participants across the region. The survey was available for 25 days. A total of 153 participants completed the questionnaire within the designated 25-day period. Survey participants were selected based on convenience random sampling, with the following criteria in mind, age group, education level, occupation, and employment status, among others. The study was restricted to learners from the Uttarakhand Open University who were either enrolled at the university at the time of the study or had graduated or dropped-out.
Table 2
The Demographic Profile of the Participants
| Variable | Description | n | % |
| Gender | Male | 73 | 47.7 |
| Female | 80 | 52.3 | |
| Age group | 19 to 25 years | 56 | 36.6 |
| 26 to 35 years | 73 | 47.7 | |
| 36 to 45 years | 24 | 15.7 | |
| Education level | 12th grade or equivalent | 18 | 11.8 |
| Undergraduate degree or equivalent | 30 | 19.6 | |
| Master’s degree or equivalent | 99 | 64.7 | |
| PhD | 6 | 3.9 | |
| Employment status | Employed | 93 | 60.8 |
| Unemployed | 60 | 39.2 | |
| Devices used to access Website | Desktop computer or laptop | 40 | 26.1 |
| Android-based mobile phone | 113 | 73.9 |
Note. N = 153.
Table 2 presents the demographic profile of the participants: There were more female participants (52.3%) than male participants (47.7%). Close to half of the participants (47.7%) were in the 26 to 35 years’ age group 36.6% were in the 19 to 25 years’ age group, and 15% were in the 36 to 45 years’ age group. More than half of the participants (64.7%) had completed a master’s program or its equivalent, 19.6% participants had completed an undergraduate program or its equivalent, 11.8% of participants had completed grade 12 or its equivalent, and 3.9% participants had PhDs in different disciplines. More than half of the participants (60.8%) were employed, whereas 39.2% were unemployed. Many participants (73.9%) used android-based mobile devices to access the university Website and e-services, while 26.1% used a desktop computer or a laptop.
Learners enrolled in various programs of study at the Uttarakhand Open University, India participated in this study of their awareness of and satisfaction with the university’s Website and e-services. This section is comprised of awareness based from the participant’s gender, age, and education level, as well as, the satisfaction level of the selected participants for these categories. The majority of participants were unaware of the e-services/facilities provided by the University to their learners. In the 2018-2019 academic year, online enrollment comprised 50.74% (28,392 learners) of total admissions to the university; whereas, in the 2019-2020 academic year, online enrollment reached 83.53% (59,568) of total admissions (Uttarakhand Open University, 2020). These rates demonstrate the substantial use of the Website by learners at the university. Therefore, ODL institutions, such as Uttarakhand Open University, should have an easily accessible Website.
This section is comprised of learner awareness of University e-services based on their gender, age, and education level. Accessing examination results and notices/announcements were the top e-services in which most of the learners were satisfied.
Table 3 and Figure 1 present the results of the analysis of learner awareness of the university’s e-services based on participants’ gender. Results show that the majority of learners (both male and female) were unaware of many of the e-services that the university provides through its Website. This result is surprising and should be of great concern to the university. Plans are needed to address the learner awareness-related shortcomings of the university’s Website.
Table 3
Learners’ Awareness of the University’s e-Services by Gender
| e-Services awareness indicatorsa | Male learners (%) | Female learners (%) | ||
| Yes | No | Yes | No | |
| A1 | 94.5 | 5.5 | 85 | 15 |
| A2 | 89 | 11 | 80 | 20 |
| A3 | 80.8 | 19.2 | 75 | 25 |
| A4 | 90.4 | 9.6 | 81.3 | 18.8 |
| A5 | 83.6 | 16.4 | 75 | 25 |
| A6 | 41.1 | 58.9 | 41.3 | 58.8 |
| A7 | 74 | 26 | 62.5 | 37.5 |
| A8 | 49.3 | 50.7 | 43.8 | 56.3 |
| A9 | 47.9 | 52.1 | 53.8 | 46.3 |
| A10 | 58.9 | 41.1 | 62.5 | 37.5 |
| A11 | 80.8 | 19.2 | 80 | 20 |
| A12 | 97.3 | 2.7 | 90 | 10 |
| A13 | 49.3 | 50.7 | 52.5 | 47.5 |
| A14 | 53.4 | 46.6 | 55 | 45 |
| A15 | 50.7 | 49.3 | 37.5 | 62.5 |
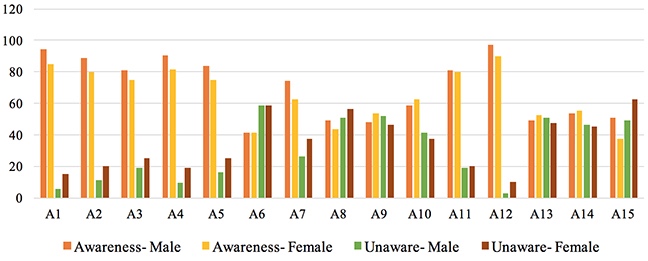
Figure 1
Learners’ Awareness of the University’s e-Services by Gender
A small percentage of learners (15% of female learners and 5.5% of male learners) were unaware of the university Website’s name (A1); 20% of female learners and 11% of male learners were unaware of the link to online admissions available on the home page of the Website (A2); 25% of female learners and 19.2% of male learners were unable to find a valid study center on the university Website (A3); 18.8% of female learners and 9.6% of male learners were unaware of the notices and announcements published on the university Website (A4); and 25% of female learners and 16.4% of male learners were unaware of the link to Student One View, an information center for student records, which is available through the university Website (A5).
In addition, 58.9% of male and 58.8% of female learners were unaware of the link to the university’s recognition letters, which is available on the Website (A6); 37.5% of female learners and 26% of male learners were unaware that they could complete an online examination/back form (additional chance to improve the score attained) application through the Website (A7); and 56.3% of female learners and 50.7% of male learners were unaware of the link to the university’s e-learning portal (A8). As e-learning is one of the main pillars of the ODL system, this result raises concern and should be addressed by policymakers and implementation units at the university. In addition, the university has a database with a large number of video-recorded lectures for learners, but only 53.8% of female learners and 47.9% of male learners were aware of the link to the lectures on the university Website (A9). Furthermore, only 62.5% of female learners and 58.9% of male learners were aware that they could access e-SILM (Electronic-Self Instructional Learning Material; A10) from the university Website.
Some learners (20% of female learners and 19.2% of male learners) were unaware that they could access old question papers (question papers of previously conducted examinations; A11) through the university Website. However, most learners (97.3% of male learners and 90% of female learners) were aware that they could download and/or view evaluation results through the Website (A12), a positive sign for the university; while 50.7% of male learners and 47.5% of female learners were unaware that they could register complaints, queries, and grievances through the Website (A13); and 46.6% of males and 45% of female learners were unaware that they could access a link to the university’s mobile application on the university Website (A14). The Frequently asked questions (FAQs) feature, which is important to any online service or Website and makes it easier for users to navigate the Website and access the e-services, answers many of the salient questions that visitors to the Website may have. However, more than half of female learners (62.5%) and 49.3% of male learners were unaware of the FAQs available on the university Website (A15).
Analysis of learners’ awareness by age group revealed that the majority of learners in the different age groups (62% of learners in the 19 to 25 year age group, 54% of learners in the 26 to 35 year age group, and 62% of learners in the 36 to 45 year age group) were unaware of the university’s recognition letters (A6), the link to the e-learning portal (A8), and the FAQs (A15); however, all age groups were aware of the online admissions (A2), access to evaluation results (A12), and Student One View (A5; see Table 4 and Figure 2). Results show that there is an urgent need to improve the visual clarity and presentation of information on the Website, especially with respect to the e-learning portal and the recognition letters, to increase learner awareness about the important information and e-services available through the Website.
Table 4
Learners’ Awareness of the University’s e-Services by Age Group
| E-services awareness indicatorsa | 19 to 25 years (%) | 26 to 35 years (%) | 36 to 45 years (%) | |||
| Yes | No | Yes | No | Yes | No | |
| A1 | 89.3 | 10.7 | 89 | 11 | 91.7 | 8.3 |
| A2 | 78.6 | 21.4 | 90.4 | 9.6 | 79.2 | 20.8 |
| A3 | 67.9 | 32.1 | 84.9 | 15.1 | 79.2 | 20.8 |
| A4 | 85.7 | 14.3 | 84.9 | 15.1 | 87.5 | 12.5 |
| A5 | 75 | 25 | 80.8 | 19.2 | 83.3 | 16.7 |
| A6 | 37.5 | 62.5 | 45.2 | 54.8 | 37.5 | 62.5 |
| A7 | 62.5 | 37.5 | 71.2 | 28.8 | 70.8 | 29.2 |
| A8 | 48.2 | 51.8 | 43.8 | 56.2 | 50 | 50 |
| A9 | 50 | 50 | 52.1 | 47.9 | 50 | 50 |
| A10 | 62.5 | 37.5 | 57.5 | 42.5 | 66.7 | 33.3 |
| A11 | 80.4 | 19.6 | 78.1 | 21.9 | 87.5 | 12.5 |
| A12 | 96.4 | 3.6 | 91.8 | 8.2 | 91.7 | 8.3 |
| A13 | 46.4 | 53.6 | 49.3 | 50.7 | 66.7 | 33.3 |
| A14 | 53.6 | 46.4 | 58.9 | 41.1 | 41.7 | 58.3 |
| A15 | 41.1 | 58.9 | 43.8 | 56.2 | 50 | 50 |
Figure 2
Learners Awareness of the University’s e-Services by Age Group
Note. Age G. = Age group.
This section comprised of learner awareness of University e-services based on their education level. The majority of the learners were found to be unaware of the e-SILM, recognition letters, and FAQs.
Analysis of learner awareness by their education level shows presented in Table 5, shows that learners with a grade 12 education, an undergraduate degree, and a master’s degree, as well as PhD scholars (66% of learners with a grade 12 education; 66% of learners with an undergraduate degree, 55% of learners with a master’s degree, and 50% of learners with a PhD) were all unaware of the university’s recognition letters (A6). They were also unaware of the link to e-SILM (A10) and FAQs (A15) available on the university Website. Therefore, the university should work on the visual clarity and presentation of this information to increase learners’ awareness of the important information and e-services available through the Website.
Table 5
Learners’ Awareness of the University’s e-Services by Education Level
| e-Services awareness indicatorsa | 12th grade or equivalent (%) | Undergraduate or equivalent (%) | Master’s or equivalent (%) | PhD (%) | ||||
| Yes | No | Yes | No | Yes | No | Yes | No | |
| A1 | 83.3 | 16.7 | 83.3 | 16.7 | 92.9 | 7.1 | 83.3 | 16.7 |
| A2 | 83.3 | 16.7 | 70 | 30 | 88.9 | 11.1 | 83.3 | 16.7 |
| A3 | 50 | 50 | 76.7 | 23.3 | 83.8 | 16.2 | 66.7 | 33.3 |
| A4 | 61.1 | 38.9 | 86.7 | 13.3 | 89.9 | 10.1 | 83.3 | 16.7 |
| A5 | 50 | 50 | 80 | 20 | 84.8 | 15.2 | 66.7 | 33.3 |
| A6 | 33.3 | 66.7 | 33.3 | 66.7 | 44.4 | 55.6 | 50 | 50 |
| A7 | 55.6 | 44.4 | 56.7 | 43.3 | 72.7 | 27.3 | 83.3 | 16.7 |
| A8 | 27.8 | 72.2 | 50 | 50 | 46.5 | 53.5 | 83.3 | 16.7 |
| A9 | 50 | 50 | 66.7 | 33.3 | 46.5 | 53.5 | 50 | 50 |
| A10 | 44.4 | 55.6 | 66.7 | 33.3 | 61.6 | 38.4 | 66.7 | 33.3 |
| A11 | 66.7 | 33.3 | 93.3 | 6.7 | 77.8 | 22.2 | 100 | 0 |
| A12 | 94.4 | 5.6 | 93.3 | 6.7 | 92.9 | 7.1 | 100 | 0 |
| A13 | 50 | 50 | 50 | 50 | 50.5 | 49.5 | 66.7 | 33.3 |
| A14 | 55.6 | 44.4 | 73.3 | 26.7 | 48.5 | 51.5 | 50 | 50 |
| A15 | 33.3 | 66.7 | 46.7 | 53.3 | 43.4 | 56.6 | 66.7 | 33.3 |
In this section learner satisfaction regarding University e-services based on their gender, age, and education level was analyzed. In the case of frequency of University e-services used, i.e., online admission, online examination form, view/download results, the majority of the learners reported that they were either satisfied or extremely satisfied.
Table 6
Learners’ Satisfaction With the University’s e-Services by Gender
| Satisfaction indicatorsa | Participant gender (levelb) | |||||||||
| Male | Female | |||||||||
| (5) | (4) | (3) | (2) | (1) | (5) | (4) | (3) | (2) | (1) | |
| Q1 | 46 | 20 | 5 | 2 | 0 | 35 | 23 | 14 | 2 | 6 |
| Q2 | 42 | 24 | 6 | 1 | 0 | 42 | 22 | 5 | 6 | 5 |
| Q3 | 38 | 21 | 11 | 3 | 0 | 38 | 16 | 9 | 11 | 6 |
| Q4 | 32 | 23 | 10 | 8 | 0 | 36 | 20 | 12 | 6 | 6 |
| Q5 | 30 | 21 | 20 | 2 | 0 | 27 | 16 | 24 | 10 | 3 |
| Q6 | 20 | 18 | 27 | 8 | 0 | 19 | 14 | 35 | 9 | 3 |
| Q7 | 18 | 23 | 24 | 8 | 0 | 10 | 24 | 32 | 11 | 3 |
| Q8 | 22 | 24 | 22 | 5 | 0 | 21 | 17 | 28 | 11 | 3 |
| Q9 | 34 | 23 | 12 | 4 | 0 | 32 | 15 | 19 | 11 | 3 |
| Q10 | 37 | 26 | 6 | 4 | 0 | 33 | 31 | 4 | 9 | 3 |
| Q11 | 17 | 11 | 19 | 16 | 10 | 15 | 12 | 23 | 17 | 13 |
| Q12 | 15 | 12 | 30 | 8 | 8 | 17 | 6 | 29 | 19 | 9 |
Table 6 shows that the majority of male and female learners were extremely satisfied with some of the e-services, such as online admissions (Q1; 90% of male learners and 71% of female learners), online examination forms (Q5; 69% of male learners and 53% of female learners), access to view and/or download evaluation results (Q10; 86% of male learners and 79% of female learners),, that the university offers learners enrolled in various programs of study at the university. However, they were dissatisfied with e-services, such as the e-learning portal (Q6; 11% of male learners and 15% of female learners), video-recorded lectures available through the Website (Q7), access to download e-SILM (Q8), the university’s mobile application (Q12), and the university’s procedures for handling complaints, queries, and grievances (Q11).
Table 7
Learners Satisfaction With the University’s e-Services by Age Group
| Satisfaction indicatorsa | Age Group (levelb) | ||||||||||||||
| 19 to 25 Years | 26 to 35 Years | 36 to 45 Years | |||||||||||||
| (5) | (4) | (3) | (2) | (1) | (5) | (4) | (3) | (2) | (1) | (5) | (4) | (3) | (2) | (1) | |
| Q1 | 33 | 12 | 7 | 1 | 3 | 34 | 26 | 9 | 3 | 1 | 14 | 5 | 3 | 0 | 2 |
| Q2 | 34 | 15 | 3 | 2 | 2 | 35 | 24 | 8 | 5 | 1 | 15 | 7 | 0 | 0 | 2 |
| Q3 | 31 | 13 | 7 | 2 | 3 | 32 | 17 | 12 | 11 | 1 | 13 | 7 | 1 | 1 | 2 |
| Q4 | 25 | 16 | 8 | 4 | 3 | 32 | 18 | 13 | 9 | 1 | 11 | 9 | 1 | 1 | 2 |
| Q5 | 20 | 12 | 17 | 5 | 2 | 27 | 19 | 20 | 7 | 0 | 10 | 6 | 7 | 0 | 1 |
| Q6 | 14 | 10 | 24 | 6 | 2 | 18 | 14 | 30 | 11 | 0 | 7 | 8 | 8 | 0 | 1 |
| Q7 | 13 | 13 | 20 | 8 | 2 | 12 | 21 | 29 | 11 | 0 | 3 | 13 | 7 | 0 | 1 |
| Q8 | 16 | 14 | 17 | 7 | 2 | 20 | 16 | 28 | 9 | 0 | 7 | 11 | 5 | 0 | 1 |
| Q9 | 23 | 14 | 10 | 7 | 2 | 31 | 17 | 18 | 7 | 0 | 12 | 7 | 3 | 1 | 1 |
| Q10 | 27 | 20 | 1 | 6 | 2 | 32 | 27 | 8 | 6 | 0 | 11 | 10 | 1 | 1 | 1 |
| Q11 | 9 | 10 | 15 | 13 | 9 | 16 | 9 | 19 | 17 | 12 | 7 | 4 | 8 | 3 | 2 |
| Q12 | 12 | 7 | 18 | 12 | 7 | 15 | 5 | 33 | 12 | 8 | 5 | 6 | 8 | 3 | 2 |
Results show the majority of the learners across age groups were satisfied with the university’s e-services, such as online admissions (Q1; 81% of learners in the 19 to 25 year age group, 82% of learners in the 26 to 35 year age group, and 78% of learners in the 36 to 45 year age group), online examination forms (Q5; 57% of learners having age group of 19 to 25 years, 63% of learners having age group of 26 to 35 years, and 66% of learners having age group of 36 to 45 years), access to view or download evaluation results (Q10);, that the university offers its learners through the Website (see Table 7). But they were dissatisfied with e-services, such as the e-learning portal (Q6; 14% of learners in the 19 to 25 year age group, 15% of learners in the 26 to 35 year age group, and 5% of learners in the 36 to 45 year age group), the video lectures uploaded to the Website (Q7), access to download e-SILM (Q8) and the university’s mobile application (Q12), and university procedures for handling complaints, queries, and grievances (Q11).
Table 8
Learners’ Satisfaction with the University’s e-Services by Education Level
| Education level | Satisfaction levelb | e-Services satisfaction indicatorsa | |||||||||||
| Q1 | Q2 | Q3 | Q4 | Q5 | Q6 | Q7 | Q8 | Q9 | Q10 | Q11 | Q12 | ||
| 12th grade or equivalent | (5) | 12 | 10 | 7 | 6 | 4 | 5 | 7 | 5 | 5 | 10 | 1 | 3 |
| (4) | 3 | 6 | 6 | 5 | 5 | 3 | 3 | 5 | 7 | 6 | 4 | 3 | |
| (3) | 1 | 0 | 3 | 4 | 7 | 8 | 6 | 6 | 4 | 0 | 4 | 7 | |
| (2) | 0 | 0 | 0 | 0 | 1 | 1 | 1 | 1 | 1 | 1 | 5 | 3 | |
| (1) | 2 | 2 | 2 | 3 | 1 | 1 | 1 | 1 | 1 | 1 | 4 | 2 | |
| Undergraduate or equivalent | (5) | 12 | 14 | 14 | 12 | 6 | 4 | 4 | 6 | 9 | 10 | 3 | 4 |
| (4) | 7 | 9 | 6 | 10 | 4 | 6 | 11 | 7 | 6 | 10 | 4 | 2 | |
| (3) | 7 | 4 | 6 | 3 | 15 | 14 | 8 | 8 | 8 | 2 | 9 | 11 | |
| (2) | 1 | 1 | 2 | 3 | 3 | 4 | 5 | 7 | 5 | 6 | 9 | 8 | |
| (1) | 3 | 2 | 2 | 2 | 2 | 2 | 2 | 2 | 2 | 2 | 5 | 5 | |
| Master’s or equivalent | (5) | 54 | 57 | 52 | 47 | 43 | 28 | 16 | 30 | 49 | 46 | 26 | 24 |
| (4) | 31 | 29 | 22 | 26 | 26 | 21 | 30 | 27 | 22 | 39 | 14 | 12 | |
| (3) | 11 | 7 | 11 | 14 | 22 | 38 | 40 | 34 | 19 | 8 | 26 | 37 | |
| (2) | 3 | 6 | 12 | 11 | 8 | 12 | 13 | 8 | 9 | 6 | 19 | 16 | |
| (1) | 0 | 0 | 2 | 1 | 0 | 0 | 0 | 0 | 0 | 0 | 14 | 10 | |
| PhD | (5) | 3 | 3 | 3 | 3 | 4 | 2 | 1 | 2 | 3 | 4 | 2 | 1 |
| (4) | 2 | 2 | 3 | 2 | 2 | 2 | 3 | 2 | 3 | 2 | 1 | 1 | |
| (3) | 0 | 0 | 0 | 1 | 0 | 2 | 2 | 2 | 0 | 0 | 3 | 4 | |
| (2) | 0 | 0 | 0 | 0 | 0 | 0 | 0 | 0 | 0 | 0 | 0 | 0 | |
| (1) | 1 | 1 | 0 | 0 | 0 | 0 | 0 | 0 | 0 | 0 | 0 | 0 | |
Learners with a grade 12 education, with an undergraduate degree, and a master’s degree, as well as PhD scholars were dissatisfied with e-services, such as use of the University’s mobile app (Q12; 27% of learners with a grade 12 education; 43% of learners with an undergraduate degree, and 26% of learners with a master’s degree), and issue with accessing complaint/grievance portal (Q11; 49% of learners with a grade 12 education; 26% of learners with an undergraduate degree, and 6% of learners with a master’s degree) whereas Online admission (Q1; 83% of learners with a grade 12 education; 63% of learners with an undergraduate degree, 85% of learners with a master’s degree, and 83% of learners with a PhD), and accessing prospectus/Notices/Announcements are the e-services with whom learners were found satisfied during the study. (Q11; see Table 8).
The analyses of learners’ satisfaction with the university’s e-services show that irrespective of gender, age group, and education level, the university must work to improve the Website’s visibility, accessibility, and appeal for all the learners. Learners’ dissatisfaction may be related to poor Internet connectivity, which hinders easy access to information and seamless use of e-services. In order to facilitate learners’ use of the university’s e-resources, such as video-recorded lectures, learning applications, and other online educational resources, there is urgent need to resolve issues of broadband and network connectivity. Addressing this issue can help learners who reside in the remote areas of the state to participate in e-learning at the university.
The emergence of ICT, and technology-enhanced teaching and learning tools, has changed the ODL system of education around the world. At present, ICTs play a key role in improving and expanding open and distance education worldwide. This study explored learner satisfaction with the website performance of an open and distance learning institution and revealed that, specifically in pandemic times, availability of adequate ICT infrastructure becomes indispensable, especially in the most remote areas of the country. There should be proper internet connectivity at all these areas to ensure e-services to its clientele is effective. The following suggestions to improve the effectiveness of university Websites and e-services in terms of user-friendliness, accessibility, and outcomes are based on the study findings. These recommendations can also be used to enhance the visibility of a university’s e-services among learners across the region:
Chiew, T. K., & Salim, S. S. (2003). WEBUSE: Website usability evaluation tool. Malaysian Journal of Computer Science, 16(1), 47-57. https://ejournal.um.edu.my/index.php/MJCS/article/view/6118/
Distance Education Council. (2009). Recognition of open and distance learning institutions. Distance Education Council. https://www.ugc.ac.in/deb/pdf/RecognitionODLInstitutionsHandbook2009.pdf
Fidalgo, P., Thormann, J., Kulyk, O., & Lencastre, J. A. (2020). Students’ perceptions on distance education: A multinational study. International Journal of Educational Technology in Higher Education, 17, 18. https://doi.org/10.1186/s41239-020-00194-2
Garett, R., Chiu, J., Zhang, L., & Young, S. D. (2016). A literature review: Website design and user engagement. Online Journal of Communication and Media Technology, 6(3), 1-14. https://doi.org/10.29333/ojcmt/2556
Hasan, L. (2014). Evaluating the usability of educational websites based on students’ preferences of design characteristics. International Arab Journal of e-Technology, 3(4), 258-269. http://www.iajet.org/documents/vol.3/no.%204/8-58521.pdf
Islam, A., & Tsuji, K. (2011). Evaluation of usage of university Websites in Bangladesh. DESIDOC Journal of Library & Information Technology, 31(6), 469-479. https://pdfs.semanticscholar.org/3df6/15bae95c22964fda5a6c8a11ee7a2b7b04cf.pdf
Jabar, M. A., Usman, U. A., & Awal, A. (2013). Assessing the usability of university Websites from users’ perspective. Australian Journal of Basic and Applied Sciences, 7(10), 98—111. http://ajbasweb.com/old/ajbas/2013/August/98-111.pdf
Manzoor, M., Hussain, W., Ahmed A., & Iqbal M. J. (2012). The importance of higher education Websites and its usability. International Journal of Basic and Applied Sciences, 1(2), 150-163. https://doi.org/10.14419/ijbas.v1i2.73
Mentes, S. A., & Turan, A. H. (2012). Assessing the usability of university Websites: An empirical study on Namik Kemal University. The Turkish Online Journal of Educational Technology, 11(3), 61-69. https://files.eric.ed.gov/fulltext/EJ989199.pdf
Mustafa, S. H., & Al-Zoua’bi, L. F. (2008). Usability of the academic Websites of Jordan’s universities: An evaluation study [Paper presentation]. The 9th International Arab Conference for Information Technology, Tunisia.
Permatasari, H. P., Harlena S., Erlangga D., & Chandra R. (2013). Effect of social media on Website popularity: Differences between public and private universities in Indonesia. World of Computer Science and Information Technology Journal, 3(2), 32-37. http://www.wcsit.org/media/pub/2013/vol.3.no.2/Effect%20of%20Social%20Media%20on%20Website%20Popularity.pdf
Raduica, F., Enache, C., & Simion, I. (2019). Effective ways of managing Websites for academic institutions. PEOPLE: International Journal of Social Sciences, 5(3), 206-214, https://doi.org/10.20319/pijss.2019.53.206214
Roy, S., Pattnaik, P. K., & Mall, R. (2014). A quantitative approach to evaluate usability of academic Websites based on human perception. Egyptian Informatics Journal, 15, 159-167. http://dx.doi.org/10.1016/j.eij.2014.08.002
Sahusilawane, W., & Hiariey, L. S. (2016). The role of service quality toward open university Website on the level of student satisfaction. Journal of Education and Learning, 10(2), 85-92. http://dx.doi.org/10.11591/edulearn.v10i2.3238
Undu, A., & Akuma, S. (2018). Investigating the usability of a university Website from the users’ perspective: An empirical study of Benue State University Website. International Journal of Computer and Information Engineering, 12(10), 922-929. https://doi.org/10.5281/zenodo.1474956
Uttarakhand Open University (2021). http://www.uou.ac.in/index.php
A1 Know the name of your university Website.
A2 Aware of online admissions link available on the Website.
A3 Know how to find the valid study centres listed on the university Website.
A4 Aware of notices or announcements published on university Website.
A5 Aware of Student One View link available on the Website.
A6 Aware of university recognition letters link available on the Website.
A7 Aware of online examination/back form application link available on the Website.
A8 Aware of the e-learning portal link available on the Website.
A9 Aware of video lectures’ link available on the Website.
A10 Aware of downloading e-SILM link from the Website.
A11 Aware of downloading old question papers link on the Website.
A12 Aware of view/download results link available on the Website.
A13 Aware of the complaints/queries/grievances link available on the Website.
A14 Aware of downloading mobile application link available on the Website.
A15 Aware of frequently asked questions (FAQs) available on the Website.
Q1 Online admissions.
Q2 View/download university prospectus.
Q3 Notices/announcements.
Q4 Important dates.
Q5 Online examination form/back form application.
Q6 e-Learning portal of the university.
Q7 Video lectures of the university.
Q8 Download e-SILM (PDF files).
Q9 Download old question papers.
Q10 View/download evaluation results.
Q11 Complaints/queries/grievances.
Q12 Mobile application of the university.

Learners' Satisfaction With the Website Performance of an Open and Distance Learning Institution: A Case Study by Dr. Gopal Datt and Dr. Gagan Singh is licensed under a Creative Commons Attribution 4.0 International License.