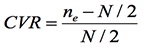
(where ne = number of experts rating the item as essential, and N = total number of experts).
Volume 21, Number 4
Kübra Açıkgül and Süleyman Nihat Şad
İnönü University, Turkey
The purpose of this study is to develop a valid, reliable, and useful scale to measure high school students’ levels of acceptance of mobile technologies in learning mathematics based on the second version of the unified theory of acceptance and use of technology (UTAUT2) model. The study was designed based on a sequential exploratory mixed-method research design. To this end, both qualitative (interviews with students, review of literature, and expert panel evaluation) and quantitative procedures (Lawshe content validity technique, exploratory and confirmatory factor analysis, convergent validity, discriminant validity, nomological validity, criterion validity, internal consistency reliability, and temporal reliability) were used to develop and validate the Mobile Technology Acceptance Scale for Learning Mathematics (m-TASLM). As a result, a 5-point Likert scale with 36 items grouped under 8 factors was developed and confirmed. Both validity and reliability studies yielded favorable results.
Keywords: mobile technology, technology acceptance, learning mathematics, UTAUT2
Fast and continuous developments in mobile and wireless technologies have made mobile devices more useful, affordable, and widely available, which, in turn, has led to an increase in their use and the popularity of mobile learning (m-learning; Park, Nam, & Cha, 2012; Wu et al., 2012). Since its inception, m-learning has attracted the attention of both researchers and practitioners (Al-Hujran, Al-Lozi, & Al-Debei, 2014; Wu et al., 2012). Reviews on the contribution of m-learning in education have pointed to its potential for improving learning achievement, motivation, and interest in the condition that it is accompanied by proper strategies during the learning process (Hwang & Wu, 2014). M-learning needs to be investigated more specifically in teaching and learning different subjects including mathematics, science, and social studies to discover more fully its effect (Chung, Hwang, & Lai, 2019). Crompton, Burke, and Gregory (2017) reported that mathematics is a popular subject of m-learning researchers. Mobile devices’ unprecedented capabilities and wide acceptance among young people can expand the boundaries of mathematics teaching and offer new ways to extend mathematical thinking beyond the classroom into the real world (McMullen, Hannula‐Sormunen, Kainulainen, Kiili, & Lehtinen, 2017). Previous researches on the use of m-learning in mathematics have yielded favorable results regarding its impact on learners’ knowledge (Riconscente, 2013), problem-solving skills (Al-Khateeb, 2018), self-competencies (Hung, Huang, & Hwang, 2014), motivations (Hung et al., 2014), and attitudes (Riconscente, 2013).
While m-learning has many advantages as demonstrated in the literature, its success is not guaranteed unless it is adopted and applied properly. However, proper adaptation and application depends on learners’ acceptance of mobile technologies (Awadhiya & Miglani, 2016; Wang, Wu, & Wang, 2009). Therefore, students’ acceptance of mobile technology needs to be investigated. With a protocol between the Ministry of National Education and Türk Telecom (a local communication company), schools in Turkey have been provided with Internet infrastructure since 2003. With the launch of the FATIH Project (The Movement to Enhance Opportunities and Improve Technology) in 2010, most teachers and students in high schools were provided with tablet computers, which means high school students in Turkey have experienced m-learning for about a decade. Thus, there is now enough background to investigate high school students’ level of acceptance of mobile technologies specifically in learning mathematics.
This study was developed to design and test a valid, reliable, and useful scale, i.e. the m-TASLM, to measure high school students’ levels of acceptance of mobile technologies in learning mathematics.
Mobile technologies have invaded our everyday life with their unprecedented and widely affordable capabilities including small size and portability, computing power and modular platform, wireless communication ability, multipurpose applications, ability to synchronize and back up with other computers, and stylus-driven interface (Pea & Maldonado, 2006). These unique characteristics coupled with the increased use of mobile devices have made these technologies convenient for education, giving rise to new terms such as e-learning and m-learning. M-learning refers to the use of mobile technologies in the learning process (Al-Hujran et al., 2014; Crompton & Burke, 2018; Park et al., 2012). More specifically, Al-Hujran et al. (2014, p. 14) defined m-learning as “integrating mobile technologies with learning and education processes.” To Crompton and Burke (2018, p. 53), m-learning denoted “learning involving the use of a mobile device.” Barati and Zolhavarieh (2012, p. 298) defined m-learning as “any form of learning and teaching process that occurs by mobile device or in [a] mobile environment.”
There is a good amount of literature on the benefits of m-learning. M-learning removes the boundaries of the classroom (Reychav, Dunaway, & Kobayashi, 2015), enabling students to learn anytime anywhere (Chung et al., 2019). In general, m-learning is best characterized by its ability to enrich learning experiences with enhanced mobility and connectivity (Cheon, Lee, Crooks, & Song, 2012). Thanks to this mobility and connectivity, students are able to learn more easily, practically, and productively (Choon-Keong, Ing, & Kean-Wah, 2013; Gikas & Grant, 2013). When accompanied with proper learning strategies, m-learning is also praised for its positive impact on students’ learning achievement (Hwang & Chang, 2011; Hwang & Wu, 2014), attitudes towards the lesson (Hwang & Chang, 2011), interest and motivation (Hwang & Chang, 2011; Hwang & Wu, 2014), as well as on problem-solving skills (Al-Khateeb, 2018; Lai & Hwang, 2014), creativity, and communication skills (Lai & Hwang, 2014).
There are however some disadvantages and barriers to using mobile learning. Among these are issues of connectivity, small screen size, limited processing power, low input capacity, security and abuse, distracting factors, reluctance to adopt, and difficulty in using technology (Awadhiya & Miglani, 2016; Wang et al., 2009). Gikas and Grant (2013) mentioned that distracting factors such as social networks and small mobile keyboards are among the difficulties experienced by students using mobile devices. Gökdaş, Torun, and Bağrıaçık (2014) attributed the pre-service teachers’ negative attitudes towards mobile learning to low Internet speed, and the poor quality or lack of digital content. Şad, Özer, Yakar, and Öztürk (2020) argued that using smartphones for learning may prevent students from achieving the degree of cognitive depth necessary for long-term retention.
M-learning in teaching mathematics. The unprecedented capacities of mobile devices (e.g., portability and availability) and their wide acceptance among young people have also influenced learning and teaching mathematics (Attard & Northcote, 2012). Since learning mathematics through mobile means helps students gain new mathematical knowledge, skills, and experiences, mobile mathematics learning has become a new area with a growing interest among educational researchers and practitioners (Kyriakides, Meletiou-Mavrotheris, & Prodromou, 2016). Several mobile and online applications have been developed to support teaching algebra, geometry, analysis, statistics, probability, and other areas of mathematics (Cayton-Hodges, Feng, & Pan, 2015; Fabian, Topping, & Barron, 2016).
The pedagogical potential of mobile applications especially in the fields of mathematics, science, and engineering stems from their advantages in helping students grasp the abstract concepts in these disciplines (Subramanya & Farahani, 2012). Using mobile devices also allows learners to become aware of their mathematical skills including measurement, prediction, and problem-solving (Fabian et al., 2016; Tangney & Bray, 2013). Allowing direct interaction with mathematical phenomena through visual and dynamic affordances on touchscreens, mobile mathematics learning provides students with opportunities for the easy transference between home and outdoor learning situations and more flexible ways to work collaboratively (Larkin & Calder, 2016). Mobile mathematics learning applications also provide opportunities to discover mathematics independently or cooperatively in real-life situations through visualization and contextualization (Baya’a & Daher, 2009).
Despite the documented advantages of m-learning, its success is not guaranteed unless it is adopted and applied properly. Proper adaptation and application depends on learners’ acceptance of mobile technologies (Awadhiya & Miglani, 2016; Wang et al., 2009). Wang et al. (2009) stated that “the success of m-learning may depend on whether or not users are willing to adopt the new technology that is different from what they have used in the past” (p. 93). Likewise, Awadhiya and Miglani (2016) have warned that learners’ reluctance to adopt specific technologies is an important challenge to m-learning.
Many theoretical models were developed with regard to technology acceptance research, each with different acceptance determinants (Venkatesh, Morris, Davis, & Davis, 2003; Venkatesh, Thong, & Xu, 2012). Researchers had a multitude of models from which to choose, though picking one meant ignoring the contributions of alternative models (Venkatesh et al., 2003). This necessitated the need to review and synthesize these models, and eventually Venkatesh et al. (2003) integrated the most specific and well-known eight models and proposed a compact model called the unified theory of acceptance and use of technology (UTAUT; Venkatesh et al., 2012; Wang et al., 2009).
Since UTAUT was originally developed to evaluate the acceptance and use of information technologies by employees, especially in the organizational context, use of the model with different technologies, users, or cultures was limited. Recognition of the need to expand and update the model emerged (Venkatesh et al., 2012; Wang et al., 2009; Yang, 2013). As a result, Venkatesh et al. (2012) extended the UTAUT model to include the consumer context and proposed UTAUT2. UTAUT2 included three additional determinant variables (hedonic motivation, price value, and habit) as important factors affecting consumers’ acceptance and use of technology. Furthermore, UTAUT2 preserved three moderator variables (gender, age, and experience) though excluded the voluntariness of use variable. As a result, the final UTAUT2 model included seven independent variables and three moderator variables representing the determinants of consumers’ behavioral intention to use a technological device. Behavioral intention and the determinants of behavioral intention in the UTAUT2 model can be defined as follows:
Although there are many studies using the UTAUT framework, a limited number of studies (Bharati & Srikanth, 2018; Kumar & Bervell, 2019; Moorthy, Yee, T’ing, & Kumaran, 2019; Ramírez-Correa, Rondán-Cataluña, Arenas-Gaitán, & Martín-Velicia, 2019; Yang, 2013) have used the UTAUT2 framework. Among these, Ramírez-Correa et al. (2019) analyzed the acceptance of online games using components of the UTAUT2 framework with 373 individuals, aged 18 to 27. Moorthy et al. (2019) attempted to determine the factors affecting university students’ behavioral intention to accept mobile learning using structured questionnaires based on components of the UTAUT2. Bharati and Srikanth (2018) modelled university students’ acceptance of mobile learning using the UTAUT2 framework, introducing two additional components: quality of service and interactive visual information. Yang (2013) also tested the factors affecting the intention of university students to adopt mobile learning, using the dimensions of UTAUT2 plus self-management of learning as a new dimension. In a recent study, Kumar and Bervell (2019), using components of the UTAUT2 model, investigated factors affecting university students’ behavioral intention to use Google Classroom as a mobile learning platform.
All these studies, whether they used the UTAUT or UTAUT2 framework, entailed the development of questionnaires to examine participants’ levels of mobile learning acceptance. The factors affecting individuals’ behavioral intentions and technology use regarding mobile learning were tested through structural equation modeling. However, most questionnaires were adapted from those developed by Venkatesh et al. (UTAUT; 2003) and Venkatesh et al. (UTAUT2; 2012), applying therelevant mobile technologies and contexts. Moreover, most of these studies failed to provide detailed information about the validity and reliability criteria of their questionnaires. The psychometric properties such as construct validity, convergent validity, divergent validity, and reliability were evaluated based on the statistics (e.g., factor loadings, composite reliability, average variance extracted, etc.) obtained as a result of structural equation modeling. Thus, Venkatesh et al. (2003) suggested that measures for the UTAUT should be viewed as preliminary, and research should be done to fully develop and validate scales to obtain favorable psychometric properties.
This research aimed to develop a m-TASLM using a sequential exploratory mixed-method research design. Sequential exploratory mixed-methods research involves a two-stage and sequential process in which the researcher begins by exploring the subject matter qualitatively, and then follows up using a quantitative strand (Creswell & Plano Clark, 2011). In the preliminary qualitative strand of the study, 25 high school students in grades 9 to 12 with experience using tablet computers in their math classes were interviewed to develop draft items for the m-TASLM. Content validity of the scale was tested by an expert panel of five people, including three measurement and evaluation experts and two mathematics education experts. In the quantitative strand, validity and reliability studies of the m-TASLM were conducted on data obtained from four independent study groups during the spring semester of the 2018-2019 school year.
First study group. Our first independent group was comprised of students representing various grade levels and types of high schools in the central districts of Malatya province in Turkey (Table 1). The data obtained from this group were used to perform an initial exploratory factor analysis (EFA).
Table 1
Individual and School Characteristics of First Study Group
| n | % | |
| Gender | ||
| Male | 234 | 44.7 |
| Female | 289 | 55.3 |
| Type of high school* | ||
| Anatolian | 413 | 79.0 |
| Science | 70 | 13.4 |
| Private | 40 | 7.6 |
| Grade level | ||
| Grade 9 | 174 | 33.3 |
| Grade 10 | 172 | 32.9 |
| Grade 11 | 125 | 23.9 |
| Grade 12 | 52 | 9.9 |
Note. N = 523.
* Anatolian high school is a common type of state school applying a general curriculum, while Science high school is more competitive providing a curriculum with more science and math courses.
Second study group. Our second independent group was comprised of 815 students representing various grade levels and types of high schools in the central districts of Malatya province in Turkey (Table 2). The data obtained from this group were used to perform confirmatory factor analysis and to estimate Cronbach’s alpha internal consistency coefficients, composite reliability (CR), average variance extracted (AVE), maximum shared variance (MSV), and average shared variance (ASV).
Table 2
Individual and School Characteristics of Second Study Group
| n | % | |
| Gender | ||
| Male | 370 | 45.4 |
| Female | 445 | 54.6 |
| Type of high school | ||
| Anatolian | 609 | 74.7 |
| Science | 136 | 16.7 |
| Private | 70 | 8.6 |
| Grade level | ||
| Grade 9 | 269 | 33 |
| Grade 10 | 263 | 32.3 |
| Grade 11 | 204 | 25 |
| Grade 12 | 79 | 9.7 |
Note. N = 815.
Third study group. Our third independent group was comprised of 83 students representing various grade levels from a private high school in the central district of Malatya province in Turkey (Table 3). The data obtained from this group were used to estimate the temporal reliability of the m-TASLM. The re-test was administered to the students one month after the first test during the spring semester of 2018-2019.
Table 3
Individual and School Characteristics of Third Study Group
| n | % | |
| Gender | ||
| Male | 36 | 43.4 |
| Female | 47 | 56.6 |
| Grade level | ||
| Grade 9 | 24 | 28.9 |
| Grade 10 | 18 | 21.7 |
| Grade 11 | 26 | 31.3 |
| Grade 12 | 15 | 18.1 |
Note. N = 83.
Fourth study group. A fourth independent group was comprised of 64 students representing various grade levels from an Anatolian high school in the central district of Malatya province in Turkey (Table 4). The data obtained from this group were used to test the criterion validity of m-TASLM.
Table 4
Individual and School Characteristics of Fourth Study Group
| n | % | |
| Gender | ||
| Male | 23 | 35.9 |
| Female | 41 | 64.1 |
| Grade level | ||
| Grade 9 | 18 | 28.1 |
| Grade 10 | 14 | 21.9 |
| Grade 11 | 16 | 25 |
| Grade 12 | 16 | 25 |
Note. N = 64.
The m-TASLM was intended to include the original components of UTAUT2 developed by Venkatesh et al. (2012): PE, EE, SI, FC, HM, H, PV, and BI. In order to develop an item pool, similar scales were examined first (Cheon et al., 2012; Venkatesh et al., 2003; Venkatesh et al., 2012; Wang et al., 2009). Next, 25 high school students were interviewed about their views and experiences using mobile technologies while learning mathematics. As a result, a collection of 69 items was developed and grouped as follows:
Scale items were arranged in the form of a 5-point Likert questionnaire. Responses ranged from 1 (strongly disagree) to 5 (strongly agree). The items were submitted to an expert panel to check content validity. Expert opinions were evaluated using the Lawshe technique (Lawshe, 1975). The content validity ratio (CVR) was calculated for each item, and the critical CVR value for the five experts was set to .99 at α = 0.05 significance level according to the following formula (Lawshe, 1975):
(where ne = number of experts rating the item as essential, and N = total number of experts).
Based on the feedback from experts, necessary corrections were made to the scale. The content validity index (CVI) was estimated for the entire scale, calculating the mean of CVRs for all remaining items (Lawshe, 1975). Next, the draft scale was examined by a Turkish linguist for issues of language and expression. Finally, five high school students were asked to check the scale for clarity and understanding, and four items with minor problems were rearranged.
Following the preliminary qualitative item development procedures, the m-TASLM was administered on the first (N =523) and second (N =815) study groups successively to test exploratory and confirmatory factor analyses. Moreover, convergent, discriminant, and nomological validity of the scale were examined using the results of the confirmatory factor analysis.
The temporal reliability of the m-TASLM was determined through test-retest analysis using two data sets obtained from 83 high school students over a one-month interval. To test the criterion validity of the scale, the correlation was estimated between the final form of the m-TASLM and the Tablet Computer Acceptance Scale, originally developed by Güngören, Bektaş, Öztürk, and Horzum (2014) to measure high school students’ acceptance of tablet computers. Finally, Cronbach’s alpha, CR, and AVE coefficients were calculated and reported.
Based on the ratings of five subject-matter experts, the content validity ratio (CVR) for each of the 69 items was calculated. The CVRs for 47 items were equal to 1, indicating perfect agreement. On the other hand, the CVRs for 5 items were equal to -0.2, for 10 items equal to 0.2, and for 7 items equal to 0.6. Thus, these 22 items (5+10+7) with CVRs less than.99 were excluded from the scale.
That left 47 items remaining, which included: 6 in the PE subscale; 8 in the EE subscale; 6 in the SI subscale; 6 in the FC subscale; 4 in the HM subscale; 6 in the H subscale; 5 in the PV subscale; and 6 in the BI subscale. Since all components of the UTAUT2 model were represented in these remaining 47 items, content validity was not impaired by the removal. In addition, the content validity index (CVI) value was equal to 1 for each subscale and overall scale. Thus, it can be said that the content validity of the m-TASLM was statistically established (Lawshe, 1975).
Exploratory factor analysis (EFA). The construct validity of the m-TASLM was initially tested using EFA in the SPSS Statistics 20 program (Hair, Black, Babin, Anderson, & Tatham, 2014; Tabachnick & Fidell, 2013). Before the analysis, the data set was checked to meet the assumptions of EFA. To this end, first, both univariate and multivariate normality assumptions for the data set for 523 cases were tested. To test univariate normality, cases with z scores exceeding ± 3.29 (p <.001) were considered outliers (Tabachnick & Fidell, 2013). Also, skewness and kurtosis values for all items were calculated and found to be between ±1 (skewness = -.800 to .693; kurtosis = -.882 to .293). To test multivariate normality, Mahalanobis distances were calculated, and a total of 60 outliers were detected for p <.001 significance level (Tabachnick & Fidell, 2013). After deleting these outliers, the data set was reduced to n = 463. Next, the missing values, not exceeding 1.1% for any item, were replaced using the series mean technique.
The correlation matrix for all items was examined and coefficients were found above.30 for all variable pairs. Also, all correlation coefficients were lower than.90, indicating no multicollinearity problem between variables. Results of the Bartlett Sphericity test (χ2 = 15290.534; df = 1081; p =.000 <.05) and KMO statistics (KMO =.961) indicated the sampling adequacy of the whole data set, while anti-image correlation coefficients for each item (r =.657 to .983) were adequate for sampling adequacy of individual items.
As a result of the EFA, item 34 in the draft scale was removed because it had close loadings (<.10) in two factors (H and FC factors); and items 10, 11, 12, 13, 14, 18, 26, 31, 37, and 41 were removed because they had loadings less than .50. The analysis results are shown in Table 5.
Table 5
Results of Exploratory Factor Analysis Using Oblimin Rotation With Kaiser Normalization
| Item | Communalities | Factor | Item-Total Cor. | |||||||
| PE | H | PV | SI | HM | FC | BI | EE | |||
| PE1 | .696 | .722 | .706 | |||||||
| PE2 | .752 | .715 | .732 | |||||||
| PE5 | .658 | .674 | .683 | |||||||
| PE3 | .718 | .637 | .735 | |||||||
| PE6 | .663 | .604 | .714 | |||||||
| PE4 | .610 | .575 | .690 | |||||||
| H33 | .645 | .747 | .438 | |||||||
| H35 | .553 | .685 | .487 | |||||||
| H36 | .564 | .549 | .558 | |||||||
| H32 | .536 | .529 | .611 | |||||||
| PV39 | .738 | .843 | .472 | |||||||
| PV38 | .681 | .817 | .451 | |||||||
| PV40 | .516 | .605 | .509 | |||||||
| SI16 | .677 | -.831 | .573 | |||||||
| SI15 | .708 | -.797 | .629 | |||||||
| SI17 | .669 | -.785 | .617 | |||||||
| SI19 | .596 | -.693 | .604 | |||||||
| SI20 | .539 | -.691 | .562 | |||||||
| HM29 | .833 | .830 | .720 | |||||||
| HM28 | .790 | .809 | .693 | |||||||
| HM27 | .758 | .740 | .700 | |||||||
| HM30 | .661 | .674 | .674 | |||||||
| FC24 | .738 | .812 | .626 | |||||||
| FC25 | .690 | .731 | .650 | |||||||
| FC21 | .665 | .694 | .630 | |||||||
| FC23 | .709 | .689 | .635 | |||||||
| FC22 | .641 | .643 | .639 | |||||||
| BI44 | .744 | -.799 | .676 | |||||||
| BI46 | .687 | -.745 | .659 | |||||||
| BI45 | .601 | -.719 | .609 | |||||||
| BI43 | .617 | -.651 | .679 | |||||||
| BI47 | .585 | -.601 | .590 | |||||||
| BI42 | .501 | -.542 | .600 | |||||||
| EE8 | .766 | .821 | .615 | |||||||
| EE9 | .662 | .605 | .627 | |||||||
| EE7 | .613 | .524 | .644 | |||||||
| Total Variance Explained (%) = 66.068 | 41.83 | 6.90 | 4.34 | 4.30 | 2.88 | 2.36 | 2.10 | 1.37 | ||
Note. Factor loadings below.500 are not shown in the table. The extraction method was principal axis factoring. PE = performance expectancy; H = habit; PV = price value; SI = social influence; HM = hedonic motivation; FC = facilitating conditions; BI = behavioral intention; EE = effort expectancy.
As it is seen in Table 5, the factor analysis yielded an 8-factor construct with 36 items explaining 66.068% of the total variance. The factor loadings, communalities, and corrected item total correlations were also favorable, proving the construct validity of the scale.
Confirmatory factor analysis (CFA). In order to further test the 36-item and 8-factor construct obtained from the EFA, a CFA was conducted using the data collected from the second study group (n = 815) in the LISREL 8.8 statistics program. Table 6 shows the goodness of fit values produced in the first CFA.
Table 6
Results of Confirmatory Factor Analysis for the 8-Factor Construct of m-TASLM
| Goodness of fit value | p | χ2/df | RMSEA | RMR | SRMR | GFI | AGFI | CFI | NFI | NNFI |
| Pre-modification | .0000* | 3.09 | .054 | .056 | .040 | .88 | .86 | .99 | .98 | .99 |
| Post-modification | .0000* | 2.44 | .044 | .058 | .041 | .90 | .89 | .99 | .99 | .99 |
Note. *p<.01; RMSEA = root-mean-square error of approximation; RMR = root mean square residual; SRMR = standardized root mean square residual; GFI = goodness of fit index; AGFI = adjusted goodness of fit index; CFI = comparative fit index; NFI = normed fit index; NNFI = non-normed fit index.
The first analysis yielded a significant p-value for the 8-factor model (χ2 = 1749.15, df = 566, p =.0000 <.01). Therefore, other goodness of fit values were examined to confirm the model. The goodness of fit values were found to be either excellent or acceptable in general, since benchmark values indicate acceptable model fit when: (a) χ2/df is less than 5; (b) RMSEA, RMR, and SRMR values are less than .08; and (c) CFI, GFI, AGFI, NFI, and NNFI values are greater than .90. They indicate excellent model fit when: (a) χ2/ df is less than 2; (b) RMSEA, RMR, and SRMR values are less than.05; and (c) CFI, GFI, AGFI, NFI, and NNFI values are greater than.95 (Brown, 2006; Hair et al., 2014; Hu & Bentler, 1999; Tabachnick & Fidell, 2013) (see pre-modification model values in Table 6). However, the values for GFI =.88 and AGFI =.86 were slightly under what is normally deemed acceptable. At this stage, the modification suggestions offered by the LISREL program were applied, by correlating residuals of items 19 and 20 in the SI factor; and items 24 and 25 in the FC factor, which statistically significantly improved the model (p <.01). As a result, the goodness of fit values of the 8-factor model became acceptable or excellent except for the AGFI value (see post-modification values in Table 6). Since AGFI = .89 was also found to be very close to the acceptable limit, it can be said that the 8-factor construct of the measurement model is confirmed adequately. The standardized factor loadings, squared standardized factor loads (R2), and t values for the model after modification are presented in Table 7.
Table 7
Standardized Factor Loadings, Squared Standardized Factor Loads (R2), and t Distribution for the Modified 8-Factor Construct of m-TASLM
| Item | Standardized loading | R2 | t |
| PE1 | .86 | .74 | 29.00 |
| PE2 | .89 | .79 | 30.67 |
| PE3 | .88 | .77 | 29.75 |
| PE4 | .81 | .66 | 26.31 |
| PE5 | .83 | .69 | 27.41 |
| PE6 | .85 | .72 | 28.29 |
| EE7 | .83 | .69 | 26.55 |
| EE8 | .85 | .72 | 27.91 |
| EE9 | .87 | .76 | 28.59 |
| SI15 | .87 | .76 | 28.73 |
| SI16 | .87 | .76 | 28.61 |
| SI17 | .86 | .72 | 28.12 |
| SI19 | .72 | .52 | 21.90 |
| SI20 | .70 | .49 | 20.96 |
| FC21 | .88 | .77 | 29.95 |
| FC22 | .85 | .72 | 27.83 |
| FC23 | .89 | .79 | 30.32 |
| FC24 | .81 | .66 | 25.82 |
| FC25 | .79 | .62 | 25.01 |
| HM27 | .90 | .81 | 30.98 |
| HM28 | .91 | .83 | 31.67 |
| HM29 | .92 | .85 | 32.15 |
| HM30 | .84 | .71 | 27.58 |
| H32 | .80 | .64 | 24.73 |
| H33 | .75 | .56 | 22.83 |
| H35 | .78 | .61 | 24.18 |
| H36 | .81 | .66 | 25.57 |
| PV38 | .85 | .72 | 26.78 |
| PV39 | .89 | .79 | 28.98 |
| PV40 | .75 | .56 | 22.83 |
| BI42 | .78 | .61 | 24.79 |
| BI43 | .82 | .67 | 26.47 |
| BI45 | .87 | .76 | 29.13 |
| BI45 | .78 | .61 | 24.87 |
| BI46 | .86 | .74 | 28.76 |
| BI47 | .80 | .64 | 25.57 |
Note. PE = performance expectancy; EE = effort expectancy; SI = social influence; FC = facilitating conditions; HM = hedonic motivation; H = habit; PV = price value; BI = behavioral intention.
As is seen in Table 7, the standardized factor loadings, R2 estimates, and the t values suggest favorable results.
In order to test the convergent, discriminant and nomological validity of m-TASLM, CR, AVE, MSV, and ASV values, inter-factor correlations, and the square root of AVE values were calculated. The results are presented in Table 8.
Table 8
Results of Convergent, Discriminant, and Nomological Validity Analysis
| Factor | 1 | 2 | 3 | 4 | 5 | 6 | 7 | 8 | CR | AVE | MSV | ASV |
| 1. PE | .85** | .94 | .73 | .59 | .41 | |||||||
| 2. EE | .77* | .85** | .89 | .72 | .61 | .34 | ||||||
| 3. SI | .70* | .56* | .81** | .90 | .65 | .49 | .31 | |||||
| 4. FC | .68* | .78* | .56* | .85** | .93 | .71 | .61 | .33 | ||||
| 5. HM | .77* | .69* | .65* | .71* | .89** | .94 | .80 | .59 | .38 | |||
| 6. H | .64* | .48* | .61* | .45* | .60* | .79** | .87 | .69 | .56 | .30 | ||
| 7. PV | .46* | .43* | .43* | .48* | .42* | .48* | .83** | .87 | .62 | .27 | .19 | |
| 8. BI | .73* | .59* | .64* | .56* | .71* | .75* | .52* | .82** | .92 | .67 | .56 | .37 |
Note. PE = performance expectancy; EE = effort expectancy; SI = social influence; FC = facilitating conditions; HM = hedonic motivation; H = habit; PV = price value; BI = behavioral intention; CR = composite reliability; AVE = average variance extracted; MSV = maximum shared variance; ASV = average shared variance.
*p <.05
** Square root of AVE
As seen in Table 8, CR values for all factors are >.70 and AVE values are >.50. Thus, it can be said that m-TASLM has convergent validity, which suggests that measures of the same concept are adequately correlated (Hair et al., 2014). Furthermore, the square root AVE values calculated for each factor are higher than the correlations between one factor and others. In addition, the criteria of AVE > MSV and AVE > ASV were satisfied. Thus, it can be said that m-TASLM also has divergent validity, which suggests that though measuring conceptually similar concepts, the measures are sufficiently different from one another (Hair et al., 2014). Finally, the values in Table 8 indicate that the correlations between factors are positive and statistically significant (p <.05), indicating the nomological validity of the m-TASLM, which suggests that each construct accurately relates with the others in a theoretically consistent way (Hair et al., 2014).
Since the normality assumptions for the data sets obtained from the Tablet Computer Acceptance Scale (skewness = -.015, kurtosis = -.607) and m-TASLM (skewness = -.633, kurtosis = -.714) were adequately satisfied, the criterion validity of the m-TASLM was tested using the Pearson correlations coefficients test. Test results revealed a positive, high, and statistically significant correlation between the two scales (r =.726, p <.05). Therefore, it can be said that m-TASLM can adequately measure a construct similar to the one measured by the Tablet Computer Acceptance Scale.
To test the reliability of scores obtained from the m-TASLM, Cronbach’s alpha internal consistency and test-retest temporal reliability coefficients were estimated. The results are shown in Table 9.
Table 9
Results of Reliability Analysis
| Factors | Cronbach’s alpha | Test-retest (r**) |
| PE | .94 | .751* |
| EE | .88 | .571* |
| SI | .91 | .772* |
| FC | .93 | .639* |
| HM | .94 | .739* |
| H | .86 | .529* |
| PV | .87 | .463* |
| BI | .92 | .738* |
Note. PE = performance expectancy; EE = effort expectancy; SI = social influence; FC = facilitating conditions; HM = hedonic motivation; PV = price value; H = habit; BI = behavioral intention.
*p <.05
**r = pearson correlations coefficient
Estimated Cronbach’s alpha coefficients for all factors were.86 and above, which indicates very good or perfect reliability (Kline, 2011, p. 70). In order to test the consistency of the responses for individuals at two points in time (with a one-month interval in between), a test-retest method was used (Hair et al., 2014). Since the normality assumptions for pre- and post-test results obtained from 83 students were adequately satisfied (skewness and kurtosis <±1), scores were tested with the Pearson correlation analysis. The analysis yielded significant positive moderate-to-high correlation coefficients for factors (r =.463 to .772). For the entire scale, the consistency was high (r =.932, p =.000<.05). Accordingly, it can be said that the scale is reliable enough against random errors depending on time. Also, the CR coefficients over.70 and AVE values over.50 for all factors (see Table 8) support evidence for the reliability of the scale (Hair et al., 2014).
In this study, a scale, called m-TASLM, to measure high school students’ level of mobile technology acceptance in learning mathematics was developed. The m-TASLM was designed to include the components of UTAUT2 developed by Venkatesh et al. (2012), specifically PE, EE, SI, FC, HM, H, PV, and BI.
Composed as a synthesis of eight technology acceptance models, UTAUT2 is an extended version of the UTAUT model for consumers (Venkatesh et al, 2012). In addition, the UTAUT2 model has a better predictive validity than other models as it can explain higher percentages of variance in behavioral intention (74%) and technology use (52%) scores (Venkatesh et al., 2012). In contrast, the UTAUT2 model was used in a limited number of studies which investigate mobile technology acceptance (Bharati & Srikanth, 2018; Kumar & Bervell, 2019; Ramírez-Correa et al., 2019; Venkatesh et al., 2012; Yang, 2013). Thus, the present is believed to contribute to both the relevant literature and practice, especially for researchers who would like to investigate learners’ tendency to use mobile technologies in learning mathematics or other subjects, after due adaptations are made.
In this comprehensive and meticulous scale development study, designed according to a sequential exploratory mixed method approach, both qualitative and quantitative research methods were used, and a 5-point Likert scale with 36 items under 8 factors, explaining 66.068% of the total variance, was developed and confirmed. Results of the validity and reliability studies showed that the m-TASLM sufficiently meets the benchmark criteria regarding validity and reliability.
Based on these results, the m-TASLM is a valid and reliable instrument to measure high school students’ acceptance levels of mobile technologies in learning mathematics. Researchers could examine the psychometric properties of the scale for different educational levels (e.g., grades 5 to 8) or for mobile technology users of any age. Furthermore, though the m-TASLM has been developed to measure mobile technology acceptance in learning mathematics, its psychometric properties could be adapted to different subjects (e.g., science, social sciences, etc.).
Al-Hujran, O., Al-Lozi, E., & Al-Debei, M. M. (2014). “Get ready to mobile learning”: Examining factors affecting college students’ behavioral intentions to use m-learning in Saudi Arabia. Jordan Journal of Business Administration, 10(1), 1-18. doi: 10.12816/0026186
Al-Khateeb, M. A. (2018). The effect of teaching mathematical problems solving through using mobile learning on the seventh grade students’ ability to solve them in Jordan. International Journal of Interactive Mobile Technologies, 12(3), 178-191. doi: 10.3991/ijim.v12i3.8713
Attard, C., & Northcote, M. (2012). Mathematics on the move: Using mobile technologies to support student learning (Part 2). Australian Primary Mathematics Classroom, 17(1), 29-32. Retrieved from https://files.eric.ed.gov/fulltext/EJ978132.pdf
Awadhiya, A. K., & Miglani, A. (2016). Mobile learning: Challenges for teachers of Indian open universities. Journal of Learning for Development-JL4D, 3(2), 35-46. Retrieved from https://files.eric.ed.gov/fulltext/EJ1108182.pdf
Barati, M., & Zolhavarieh, S. (2012). Mobile learning and multi mobile service in higher education. International Journal of Information and Education Technology, 2(4), 297-299. doi: 10.7763/IJIET.2012.V2.135
Baya’a, N., & Daher, W. (2009, April). Students’ perceptions of mathematics learning using mobile phones. In Proceedings of the International Conference on Mobile and Computer Aided Learning (Vol. 4, pp. 1-9). Retrieved from https://staff-old.najah.edu/sites/default/files/Students%20Perceptions%20of%20Mathematics%20Learning%20Using%20Mobile%20Phones.pdf
Bharati, V. J., & Srikanth, R. (2018). Modified UTAUT2 model for m-learning among students in India. International Journal of Learning and Change, 10(1), 5-20. doi: 10.1504/IJLC.2018.089532
Brown, T. A. (2006). Confirmatory factor analysis for applied research. New York: The Guilford Press.
Cayton-Hodges, G. A., Feng, G., & Pan, X. (2015). Tablet-based math assessment: What can we learn from math apps? Journal of Educational Technology and Society, 18(2), 3-20. Retrieved from https://drive.google.com/file/d/1E27925VbJPhsMtGNKd4SAyx_BQhxZloU/view
Cheon, J., Lee, S., Crooks, S. M., & Song, J. (2012). An investigation of mobile learning readiness in higher education based on the theory of planned behavior. Computers and Education, 59(3), 1054-1064. doi: 10.1016/j.compedu.2012.04.015
Choon-Keong, T., Ing, N. S. & Kean-Wah, L. (2013). Readiness for mobile learning at a public university in East Malaysia. In M. A. Embi & N. M. Nordin (Eds.), Mobile Learning: Malaysian Initiatives & Research Findings (pp. 27-38). Bangi: Centre for Academic Advancement.
Chung, C. J., Hwang, G. J., & Lai, C. L. (2019). A review of experimental mobile learning research in 2010-2016 based on the activity theory framework. Computers and Education, 129, 1-13. doi: 10.1016/j.compedu.2018.10.010
Creswell, J. W., & Plano Clark, V. L. (2011) Designing and conducting mixed methods research (2nd ed.). Thousand Oaks, CA: Sage Publications.
Crompton, H., Burke, D., & Gregory, K. H. (2017). The use of mobile learning in PK-12 education: A systematic review. Computers and Education, 110, 51-63. doi: 10.1016/j.compedu.2017.03.013
Crompton, H., & Burke, D. (2018). The use of mobile learning in higher education: A systematic review. Computers and Education, 123, 53-64. doi: https://doi.org/10.1016/j.compedu.2018.04.007
Fabian, K., Topping, K. J., and Barron, I. G. (2016). Mobile technology and mathematics: Effects on students’ attitudes, engagement, and achievement. Journal of Computers in Education, 3(1), 77-104. doi: 10.1007/s40692-015-0048-8
Fishbein, M., & Ajzen, I. (1975). Belief, attitude, ıntention and behaviour: An introduction to theory and research. Reading, MA: Addison-Wesley.
Gikas, J., & Grant, M. M. (2013). Mobile computing devices in higher education: Student perspectives on learning with cellphones, smartphones, and social media. The Internet and Higher Education, 19, 18-26. doi: 10.1016/j.iheduc.2013.06.002
Gökdaş, İ., Torun, F., & Bağrıaçık, A. (2014). Teacher candidates’ mobile phones educational use situations and opinions on mobile learning. Adnan Menderes University Journal of Educational Sciences, 5(2), 43-61.
Güngören, Ö. C., Bektaş, M., Öztürk, E., & Horzum, M. B. (2014). Acceptance of TPC scale -validity and reliability study. Education and Science, 39(176), 69-79. Retrieved from http://egitimvebilim.ted.org.tr/index.php/EB/article/view/3497/846
Hair, J. F., Jr., Black, W. C., Babin, B. J., Anderson, R. E., & Tatham, R. L. (2014). Multivariate data analysis (7th ed.). London: Pearson New International Edition.
Hu, L., & Bentler, P. M. (1999). Cutoff criteria for fit indexes in covariance structure analysis: Conventional criteria versus new alternatives. Structural Equation Modeling: A Multidisciplinary Journal, 6(1), 1-55. doi: 10.1080/10705519909540118
Hung, C. M., Huang, I., & Hwang, G. J. (2014). Effects of digital game-based learning on students’ self-efficacy, motivation, anxiety, and achievements in learning mathematics. Journal of Computers in Education, 1(2-3), 151-166. doi: 10.1007/s40692-014-0008-8
Hwang, G. J., & Chang, H. F. (2011). A formative assessment-based mobile learning approach to improving the learning attitudes and achievements of students. Computers and Education, 56(4), 1023-1031. doi: 10.1016/j.compedu.2010.12.002
Hwang, G. J., & Wu, P. H. (2014). Applications, impacts and trends of mobile technology-enhanced learning: A review of 2008-2012 publications in selected SSCI journals. International Journal of Mobile Learning and Organisation, 8(2), 83-95. doi: 10.1504/IJMLO.2014.062346
Kline, R. B. (2011). Principles and practice of structural equation modeling (3rd ed.). New York: Guilford Press.
Kumar, J. A., & Bervell, B. (2019). Google Classroom for mobile learning in higher education: Modelling the initial perceptions of students. Education and Information Technologies, 24(2), 1793-1817. doi: 10.1007/s10639-018-09858-z
Kyriakides, A. O., Meletiou-Mavrotheris, M., & Prodromou, T. (2016). Mobile technologies in the service of students’ learning of mathematics: The example of game application ALEX in the context of a primary school in Cyprus. Mathematics Education Research Journal, 28(1), 53-78. doi: 10.1007/s13394-015-0163-x
Lai, C. L., & Hwang, G. J. (2014). Effects of mobile learning time on students’ conception of collaboration, communication, complex problem-solving, meta-cognitive awareness and creativity. International Journal of Mobile Learning and Organisation, 8(3-4), 276-291. doi: 10.1504/IJMLO.2014.067029
Larkin, K., & Calder, N. (2016). Mathematics education and mobile technologies. Mathematics Education Research Journal, 28(1), 1-7. doi: 10.1007/s13394-015-0167-6
Larkin, K., & Calder, N. (2016). Mathematics education and mobile technologies. Mathematics Education Research Journal, 28(1), 1-7. doi: 10.1007/s13394-015-0167-6
Lawshe, C. H. (1975). A quantitative approach to content validity. Personnel Psychology, 28(4), 563-575. doi: 10.1111/j.1744-6570.1975.tb01393.x
Limayem, M., Hirt, S. G., & Cheung, C. M. (2007). How habit limits the predictive power of intention: The case of information systems continuance. MIS Quarterly, 31(4), 705-737. doi: 10.2307/25148817
McMullen, J., Hannula‐Sormunen, M. M., Kainulainen, M., Kiili, K., & Lehtinen, E. (2017). Moving mathematics out of the classroom: Using mobile technology to enhance spontaneous focusing on quantitative relations. British Journal of Educational Technology, 50(2), 562-573. doi: 10.1111/bjet.12601
Moorthy, K., Yee, T. T., T’ing, L. C., & Kumaran, V. V. (2019). Habit and hedonic motivation are the strongest influences in mobile learning behaviours among higher education students in Malaysia. Australasian Journal of Educational Technology, 35(4), 174-191. doi: 10.14742/ajet.4432
Park, S. Y., Nam, M. W., & Cha, S. B. (2012). University students’ behavioral intention to use mobile learning: Evaluating the technology acceptance model. British Journal of Educational Technology, 43(4), 592-605. doi: 10.1111/j.1467-8535.2011.01229.x
Pea, R., & Maldonado, H. (2006). WILD for learning: Interacting through new computing devices, anytime, anywhere. In K. Sawyer (Ed.), Cambridge Handbook of Learning Sciences (pp. 427-442). Cambridge: Cambridge University Press.
Ramírez-Correa, P., Rondán-Cataluña, F. J., Arenas-Gaitán, J., & Martín-Velicia, F. (2019). Analysing the acceptation of online games in mobile devices: An application of UTAUT2. Journal of Retailing and Consumer Services, 50, 85-93. doi: 10.1016/j.jretconser.2019.04.018
Reychav, I., Dunaway, M., & Kobayashi, M. (2015). Understanding mobile technology-fit behaviors outside the classroom. Computers and Education, 87, 142-150. doi: 10.1016/j.compedu.2015.04.005
Riconscente, M. M. (2013). Results from a controlled study of the iPad fractions game Motion Math. Games and Culture, 8(4), 186-214. doi: 10.1177/1555412013496894
Subramanya, S., & Farahani, A. (2012). Point-of-view article on: Design of a smartphone app for learning concepts in mathematics and engineering. International Journal of Innovation Science, 4(3), 173-184. Retrieved from https://www.emerald.com/insight/content/doi/10.1260/1757-2223.4.3.173/full/html
Şad, S.N, Özer, N., Yakar, Ü., & Öztürk, F. (2020) Mobile or hostile? Using smartphones in learning English as a foreign language, Computer Assisted Language Learning. Advance online publication. doi: 10.1080/09588221.2020.1770292
Tabachnick, B. G., & Fidell, L. S. (2013). Using multivariate statistics (6th ed.). Boston, MA: Pearson.
Tangney, B., & Bray, A. (2013, October). Mobile technology, maths education and 21C learning. In 12th World Conference on Mobile and Contextual Learning (mLearn 2013) (Vol. 2013, No. 3, p. 7). Hamad bin Khalifa University Press (HBKU Press).
Venkatesh, V., Morris, M. G., Davis, G. B., & Davis, F. D. (2003). User acceptance of information technology: Toward a unified view. MIS Quarterly, 27(3), 425-478. doi: 10.2307/30036540
Venkatesh, V., Thong, J. Y., & Xu, X. (2012). Consumer acceptance and use of information technology: Extending the unified theory of acceptance and use of technology. MIS Quarterly, 36(1), 157-178. doi: 10.2307/41410412
Wang, Y. S., Wu, M. C., & Wang, H. Y. (2009). Investigating the determinants and age and gender differences in the acceptance of mobile learning. British Journal of Educational Technology, 40(1), 92-118. doi: 10.1111/j.1467-8535.2007.00809.x
Wu, W. H., Wu, Y. C. J., Chen, C. Y., Kao, H. Y., Lin, C. H., & Huang, S. H. (2012). Review of trends from mobile learning studies: A meta-analysis. Computers and Education, 59(2), 817-827. doi: 10.1016/j.compedu.2012.03.016
Yang, S. (2013). Understanding undergraduate students’ adoption of mobile learning model: A perspective of the extended UTAUT2. Journal of Convergence Information Technology, 8(10), 969-979. Retrieved from https://pdfs.semanticscholar.org/95ff/fb4b6f2a59b13db3ec755b0ab4cd1911008a.pdf

Mobile Technology Acceptance Scale for Learning Mathematics: Development, Validity, and Reliability Studies by Kübra Açıkgül and Süleyman Nihat Şad is licensed under a Creative Commons Attribution 4.0 International License.