Figure 1. A report of students’ activity by various measures.
Volume 21, Number 4
Shiran Michaeli, Dror Kroparo, and Arnon Hershkovitz
School of Education, Tel Aviv University, Israel
Education dashboards are a means to present various stakeholders with information about learners, most commonly regarding the learners’ activity in online learning environments. Typically, an education dashboard for teachers will include some type of visual aids that encourage teachers to reflect upon learner behavior patterns and to act in accordance to it. In practice, this tool can assist teachers to make data-driven decisions, thus supporting their professional growth, however, so far, the use of education dashboards by teachers has been greatly understudied. In this research we report on two studies related to the associations between the use of education dashboards by elementary school teachers and the teachers’ professional growth. We used the framework defined by the International Society for Technology in Education’s (ISTE) Standards for Educators. In the first study, we took a quantitative approach (N=52 teachers), using an online self-report questionnaire, and found that the use of dashboards is positively associated with professional growth in the dimensions of facilitator, analyst, designer, and citizen. In the second study, we took a qualitative approach (N=9 teachers), using semi-structured interviews, to shed light on the mechanisms through which teachers benefit from the use of education dashboards.
Keywords: teachers, education dashboard, professional development, data-driven decision-making, elementary school
The use of educational technologies has become mainstream in many teaching and learning settings. Specifically, the use of computing devices and online learning environments by students in grade schools today appear to be the norm in many countries (Allen & Seaman, 2017; Richardson et al., 2013; Wishart, 2017). Whether the online learning component is integrated as part of the school-based activities or as homework assignments (in most cases, it is a combination of both), teachers face the need to deal with hybrid learning spaces, which include the physical classroom and the online learning environment. While teachers are trained for observing (and responding to) what is happening in the physical environment, where students’ actions are normally visible and communication with students is primarily spoken, they often lack the means to observe and respond to what is happening under the hood of the virtual environments. Indeed, teaching experience was found to be negatively correlated with teachers’ communication self-efficacy and self-directed learning in online teaching (Hung, 2016).
Evidently, in such hybrid learning spaces, teachers face challenges referring to many facets of the teaching profession. In previous studies, we have shown that one-to-one computing programs (where each student has their own portable computer) may affect pedagogical behavior, for example in the ways in which teachers prepare themselves to teach lessons, how they choose to divide the lesson time between different teaching strategies, or how they assess students (Hershkovitz & Karni, 2018; Hershkovitz, Merceron, & Shamaly, 2019).
In that light, it may be useful to think of teachers as decision-makers. Indeed, teachers constantly make decisions—before, during, and after lessons—to better support their students and themselves. Such decisions may include: which content to focus on; how to best engage the students with content; whether to, or how to, partition the classroom into smaller learning units; or how to evaluate a students’ learning. In many cases, such decisions are taken based on the teacher’s experience and understanding of the situation, and not necessarily on empirical evidence (Annerstedt & Larsson, 2010; Hay & Macdonald, 2008; Vanlommel, Van Gasse, Vanhoof, & Van Petegem, 2017).
However, when teaching in hybrid spaces, teachers could use data about learners that is gathered automatically and continuously. Specifically, many online learning systems log students’ activity in three dimensions: The action taker (who?), the action itself (what?), and the action time (when?). Analyzing these data, it is possible to calculate a plethora of measurements of the learning process (Lang, Siemens, Wise, & Gašević, 2017). As the use of such systems has grown world-wide, it has become clear that these data should be made accessible to teachers in a way that is easy to understand and to act upon. One of the most common ways to communicate such data to teachers is via an education dashboard, that is, a display which presents education stakeholders with data-driven information regarding teaching and learning processes. Education dashboards are considered as practical tools for teachers to meet the daily challenges they face and to promote the use of technology as an integral part of their teaching (Rienties, Herodotou, Olney, Schencks, & Boroowa, 2018; Xhakaj, Aleven, & McLaren, 2016; Yoo, Lee, Jo, & Park, 2015).
Indeed, many learning management systems and learning platforms today offer teachers with dashboards that provide them information about various aspects of their students’ learning; for example, some popular platforms include: BrainPop (http://www.brainpop.com), Khan Academy (http://khanacademy.org), Google Classroom (http://classroom.google.com), and Canvas (http://www.canvas.net). However, evidence of their use and the impact on teachers’ professional development is still inadequate. Recent preliminary findings demonstrate how education dashboard can affect teachers’ pedagogical decision-making and improve interactions with their students (Ez-zaouia, Tabard, & Lavoué, 2020; Molenaar & Knoop-van Campen, 2018; Tissenbaum & Slotta, 2019). The current paper aims at bridging this gap. We take a broad perspective on teachers’ professional development, in accordance with the understanding that professional development is an ongoing process that crosses a teacher’s professional and personal circles and is not limited to institutional training (Collinson et al., 2009; Nabhani & Bahous, 2010). Therefore, we aim at understanding how teachers can benefit from technological tools, not only in their daily work but also in a broader sense of their ongoing professional development, may contribute to a more effective integration of technology into schools and to more effective professional development.
Current teacher professional development is a process that starts with a teacher’s pre-service training and concludes at the end of the teacher’s professional career or at the teacher’s retirement, and includes various forms of education, both formal and non-formal (Avidov-Ungar, 2016; Collinson et al., 2009). As such, the term professional development refers to various aspects of teaching and to different periods in the teacher’s career. Among others, these include the deepening of the teachers’ understanding of pedagogies and of the students’ learning; the development of responsibility and commitment to the teaching profession; and the ways technology may impact teaching and learning (Darling-Hammond & McLaughlin, 1995; Hargreaves, 2005).
Consequently, there is a plethora of models that describe teachers’ professional development. They do not necessarily consider it as a linear, step-wise experience, but rather as an ongoing, dynamic, multi-contextual endeavor that involves multiple circles in which the teacher belongs (e.g., school, professional communities, and home; Ferreira, Ryan, & Tilbury, 2007; Grossi, Oliveira, Barbosa, & Oliveira, 2016; Yurtseven Avci & O’Dwyer, 2016). In recent years, it is agreed, therefore, that teachers’ professional development presents a continuum of life-long learning throughout a professional teaching career (Collinson et al., 2009); moreover, it is closely linked to both their professional and personal identity and exists not only as part of institutional training (Nabhani & Bahous, 2010).
Additionally, one should note that current age, a teacher’s identity comprises of more than just delivering content during lessons (no matter what pedagogical or technological tools and techniques they use). Danielson’s (2011) Framework for Teaching details four domains based on which teaching should be assessed; these dimensions—planning and preparation, classroom environment, instruction, and professional responsibility—portray a broad view of the teaching profession. Even more prominently, the Standards for Educators, presented by the International Society for Technology in Education (ISTE; 2007), set a general framework that describes seven standards for today’s teachers. The standards are:
We chose this framework to study teachers’ professional development because of its broad view, and because it directly refers to the teachers’ roles in the digital era.
Data-driven decision making refers to collecting, understanding, and analyzing educational data, and is considered an integral part of a teacher’s professional conduct (Mandinach, 2012). Using data for educational decision making is not something new, as teachers have been using grades, students’ work, and behavioral data since very early schooling days (Mandinach, 2012; Schifter, 2014). Overall, teachers use such data to evaluate their class and individual students, and also to reflect upon their own teaching (Light et al., 2005; Molenaar & Knoop-van Campen, 2018), and also to communicate with various stakeholders, such as their students or their students’ parents, or the school’s educational and management teams.
In hybrid learning spaces, the amount of data per student have dramatically increased (Mandinach, 2012), and nowadays, teachers need to handle a wide range of data gathered from various educational technologies (Schifter, 2014; Xhakaj et al., 2016). Additionally, the pressure on them to make accurate decisions keeps on growing (Faria et al., 2014). This has led to an increase in research and development of education dashboard, particularly to support teachers who teach in blended environments (Schwendimann et al., 2017; Yoo et al., 2015).
To put it simply, an education dashboard is a display that presents educational stakeholders with data-driven information (usually visual) regarding teaching and learning processes in such a way that will promote reflection on their behavior patterns and help them to adjust their actions accordingly (Schwendimann et al., 2017; Yoo et al., 2015). Education dashboards could contain various types of information, such as an overview of the course activity, time per tasks, students’ skills, misconceptions, test results, social interaction, and students’ current and historical progress in the course (Charleer, Klerkx, Duval, De Laet, & Verbert, 2016; Matuk et al., 2016).
Many studies have shown that education dashboards can be used as a decision-making tool that supports teachers in planning their curricula, evaluating the class knowledge level, and the tracking of individual students (Molenaar & Knoop-van Campen, 2018; Schifter, 2014; Xhakaj, Aleven, & McLaren, 2017). Furthermore, it was shown that the use of dashboards had led teachers to better tailor their teaching (in terms of both content and style) to students’ needs, to collaborate more effectively with their colleagues, and to reflect upon their own professional conduct and abilities (Light, Wexler, & Heinze, 2005; Schifter, 2014; Schwendimann et al., 2017; Xhakaj et al., 2016). That is, this process may be seen as an integral part of a teacher’s continuous professional development. However, evidence regarding the impact of education dashboards on the development of a teacher’s skills is still limited (Gillet et al., 2017; Schwendimann et al., 2017), and as such, this will be the focus of our study. In this research, we address the following questions:
This study was quantitative in nature (N=52), involving teachers’ self-report, via an online questionnaire, of their experience using a specific education dashboard (to their choice), doing so through the lens of their professional development (see details under Instrument below). We distributed a hyperlink to the online research questionnaire via Facebook, as well as via professional and personal mailing lists. We collected the data during June 2018-January 2019.
Research variables. Background variables included Gender, Age, Teaching Seniority, and Domain of Teaching. Independent variable was Experience with the Education Dashboard; for matters of simplicity, we measured it by two categories: “Starting at the Previous School year [2017/8] for the First Time,” or “Started Earlier Than the Previous School Year.”
Seven dependent variables are based on the dimensions defined by the International Society for Technology in Education (ISTE) Standards for Educators (Trust, 2018), specifically: Learner, Leader, Citizen, Collaborator, Designer, Facilitator, and Analyst. Each of these variables measures to what extent participants grew on the corresponding dimensions.
Research population. Participants were teachers (N=52, 50 females and 2 males) in public elementary schools acorss Israel who met the inclusion criteria: they used at least one education dashboard as part of their teaching practice during the school year previous to data collection. Participants were aged between 25 to 66 years (M=41.5, SD=8.4), and had 2 to 42 years of teaching experience (M=15.8, SD=8.9). Of the participants, 11 (21%) started using the learning environment to which they referred in the questionnaire during the previous school year (2017/8); 13 participants (25%) started using that learning environment’s education dashboard during the previous school year (2017/8). The remaining participants had used the learning environment or the education dashboard for longer. Most of the participants reported using an online learning environment for Mathematics (26, 50%), with less use reported for subjects in Science (5, 10%), Language (6, 12%), Social Sciences (2, 4%), or for multiple topics (13, 25%).
Instrument. The main part of our questionnaire was based on ISTE Standards for Educators (Trust, 2018). These standards are designed around seven themes: Learner, Leader, Citizen, Collaborator, Designer, Facilitator, and Analyst, each explicitly defining a set of actionable, measurable items. For example, under the first theme, Learner, there are three items (1a-1c), the first of which is: “Set professional learning goals to explore and apply pedagogical approaches made possible by technology and reflect on their effectiveness.” Overall, there are 24 items.
Based on these Standards and items, we developed 23 self-report items (two items of the Collaborator dimension were merged into one questionnaire item) that directly connect the use of education dashboard to the various themes. For example, based on item 1a from the Standards, we phrased the following questionnaire item: “Using this dashboard assists me in setting professional goals to develop my pedagogical ability.” Questionnaire items were phrased as short as possible, while keeping the meaning of the original item. Items were ranked on a 5-point Likert scale (from 1 “Not at All” to 5 “To a Large Extent”). The items were reviewed by a few education experts to make sure they correctly reflected the nature of the original standard; this process had been taken for a few rounds until full agreement was achieved between the experts. Each variable then was calculated based on the mean of its corresponding items. In order to test for reliability, and as we have only a few items for each dimension, we calculated average inter-item correlations instead of using the more common Cronbach’s alpha test. We used the non-parametric Spearman’s test to get the acceptable values of 0.46-0.79. The full list of items, including the inter-item correlation values, is provided in Table 1.
When filling out the questionnaire, after explaining what we meant by an “education dashboard,” participants were asked to mention one online learning environment they used with the education dashboard that they had had experience with, and to refer to this dashboard while responding to the remaining items. We then made sure that the mentioned dashboards were indeed eligible, that is, that they were considered an education dashboard as defined in the literature. Overall, participants had referred to nine different educational systems, which represent most of the certified platforms in use in Israel (approved by the Israeli Ministry of Education), in various disciplines. By referring to multiple types of education dashboards and various disciplines, we allow for an increased variance in our population, which contributes to the generalization of our findings. Additionally, the online questionnaire was used to collect data about the background variables.
Table 1
Research Questionnaire, Based on ISTE Standards for Educations (Study 1)
| Variable (mean inter-item Spearman’s correlation) | Questionnaire item (Original item in ISTE standards) |
| Learner (ρ=0.46) | Using this dashboard assists me in setting professional goals to develop my teaching (1a). |
| Using this dashboard allows me to take part in various communities that relate to my professional interests (1b). | |
| I stay current with research and updates regarding the use of dashboards to promote my students’ learning (1c). | |
| Leader (ρ=0.71) | I promote the use of dashboards through joint work with education stakeholders within and outside school (2a). |
| Using this dashboard assists me address the social and cultural and interpersonal differences among my students (2b). | |
| For my colleagues I am a model of adopting dashboards for teaching (2c). | |
| Citizen (ρ=0.60) | Using this dashboard contributes to the creation of social responsibility and empathic behavior in my classroom (3a). |
| Using this dashboard allows me to establish a learning culture that promotes curiosity and criticism (3b). | |
| Using this dashboard allows me to mentor my students on how to use learning materials in a safe and effective way (3c). | |
| Through using this dashboard, I model my students how to manage personal data and data privacy (3d). | |
| Collaborator (ρ=0.61) | As a result of using this dashboard, I collaborate with colleagues to create authentic learning experiences for my students (4a). |
| Using this dashboard allows me to collaborate and co-learn with my students about effective uses of technology (4b). | |
| Using this dashboard allows me to emphasize the cultural diversity in my classroom to students, parents, and colleagues, thereby making them all partners in the learning process (4d). | |
| Designer (ρ=0.79) | Using this dashboard allows me to personalize learning experiences for my students that encourage independent learning (5a). |
| Using this dashboard allows me to design learning activities that foster active and deep learning (5b). | |
| Using this dashboard allows me to apply instructional design principles to promote student engagement and assist their learning (5c). | |
| Facilitator (ρ=0.72) | Using this dashboard allows to foster a culture where students take ownership of their learning, individually and collectively (6a). |
| Using this dashboard helps my student to foster learning strategies (6b). | |
| Using this dashboard allows me to create challenging, innovative learning opportunities for my students (6c). | |
| Using this dashboard allows me to foster creative discourse about ideas, knowledge, and connections (6d). | |
| Analyst (ρ=0.64) | Using this dashboard allows me to provide my students with diverse ways to demonstrate their ability (6a). |
| Using this dashboard allows me to give my students formative and summative assessments (6b). | |
| Using this dashboard allows me to encourage my students’ self-direction by communicating with students, parents and education stakeholders (6c). |
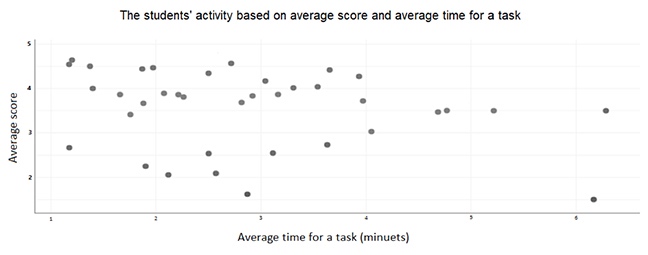
Research tools. In this qualitative study, which was part of a broader study of technology orchestration in the mathematics classroom, we used a semi-structured interview. The design of the interview allowed to deviate from the protocol and capture the natural behavior and insights of the participants. During the interview, we presented to the participating teachers three types of data visualization of students’ activity that were presumably taken from an online learning environment for mathematics; the visualizations were fabricated by the research team. These visualizations were a scatter plot, a table, and a bar chart; these types were chosen as they are among the most common information visualizations (Khan & Khan, 2011). The scatterplot presented students’ activity, based on the average score (x-axis) and time on tasks (y-axis), where each student was represented as a circle (Figure 1); the table presented detailed information about the activity of each student in 6 dimensions: the number of completed tasks, the average score for a task, the average time for a task, the task with the highest score, the task with the lowest score, and last seen (Figure 2); lastly, the bar chart presented the number of students that master each topic (e.g., decimal fraction, percentage, ratio, scale etc.; Figure 3).
Figure 1. A report of students’ activity by various measures.
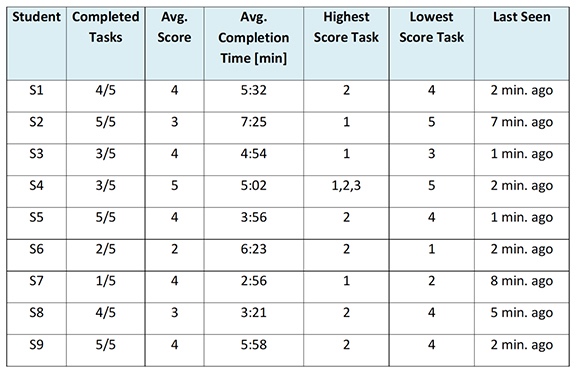
Figure 2. Students’ activity on a scatter plot of time on task (x-axis) and score (y-axis).
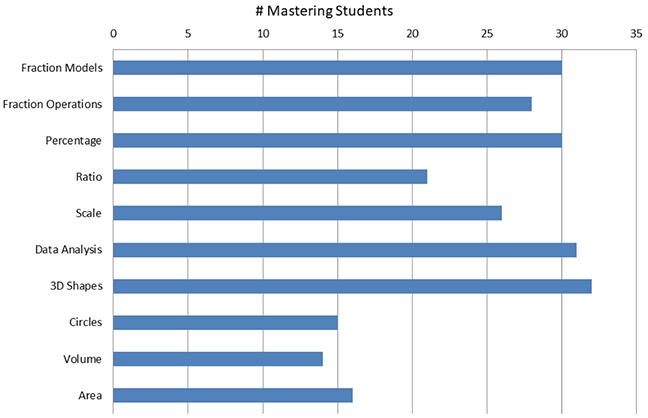
Figure 3. A bar chart of topic proficiency.
Research population. Nine mathematics teachers, all females aged between 27 to 52 years with 4 to 29 years of teaching experience, participated in the study. All participants were teaching in public elementary schools from various geographical areas in Israel at the time of the study. Some of the teachers had additional roles in or outside of school, such as a mathematics teachers’ trainer or a mathematics coordinator. Participating teachers were recruited in a snowball fashion, with the inclusion criteria being that they integrated the online environment for mathematics in their teaching (either in the classroom or for homework assignments) at least once a week. A description of the research population is given in Table 2.
Table 2
Study 2 Participants
| Participant code | Age | Teaching experience [years] | Grade(s) taught |
| T1 | 33 | 9 | 6 |
| T2 | 52 | 28 | 4-6 |
| T3 | 41 | 17 | 5 |
| T4 | 47 | 9 | 3 |
| T5 | 49 | 25 | 3-4 |
| T6 | 52 | 29 | 3-4 |
| T7 | 39 | 10 | 6 |
| T8 | 29 | 6 | 5-6 |
| T9 | 27 | 4 | 1 |
Research process. Interviews were conducted during October-December 2018. The interviews lasted about 30 minutes and were recorded. Some of the interviews were carried out via video conference (using Google Meet), and some were carried out over the phone. The data visualizations presented to the teachers via Google Drawings. All the interviews were fully transcribed before analysis.
Qualitative content analysis was conducted under our theoretical framework for assessing teachers’ professional development. The unit of analysis was teachers’ statements related to professional development. We used the Direct Content Analysis method (Hsieh & Shannon, 2005) with seven variables derived from ISTE’s Standard for Educators; specifically, statements about professional growth were categorized into seven groups: learner, leader, citizen, collaborator, designer, facilitator, and analyst. The first author had coded one interview-transcript, and then reviewed it with the third author; these two authors discussed the coding and came to an agreement regarding conflictual coding schemes. The remaining interviews were then coded by the first author.
We found no associations between age or teaching seniority with either of the dependent variables.
Due to the small population size and the distributions of the research variables, which are not necessarily normal, we used non-parametric tests. Specifically, we used Mann-Whitney U test for examining associations between the dependent variables and participants’ experience with the education dashboard; this test is valid also in cases of unequal sample sizes and unequal variance of compared groups (Mann & Whitney, 1947). We find that, on average, the teachers with a longer experience with an education dashboard—compared with those who have a year or less experience—scored higher on Facilitator (M=3.9, SD=1.0, and M=2.9, SD=1.1, respectively, with Z=2.56, at p<0.05) and Analyst (M=3.8, SD=1.0, and M=3.0, SD=1.2, respectively, with Z=2.14, at p<0.05). (We report on Z score, which is calculated based on an approximation to the standard normal distribution and is served as the basis for the p-value calculation.) These differences denote large effect sizes of d=0.78, and d=0.7, respectively. Results are summarized in Table 3.
Table 3
Comparing Dependent Variables Based on Usage Experience (Dark Gray Background Denotes Significant Differences)
| Variable | Dashboard experience [years] | Z¥ | |
| ≤1 (N=13) | >1 (N=39) | ||
| Learner | 2.8 (0.8) | 3.0 (1.1) | 0.16 p=0.87 |
| Leader | 3.2 (1.1) | 3.4 (1.2) | 0.69 p=0.49 |
| Citizen | 2.9 (1.3) | 3.5 (1.0) | 1.24 p=0.21 |
| Collaborator | 3.1 (1.4) | 3.4 (1.1) | 0.65 p=0.52 |
| Designer | 3.4 (1.3) | 3.9 (1.0) | 1.44 p=0.15 |
| Facilitator | 2.9 (1.1) | 3.9 (1.0) | 2.56* d=0.78 |
| Analyst | 3.0 (1.2) | 3.8 (1.0) | 2.14* d=0.70 |
* p<0.05, ¥ Based on Mann-Whitney U test.
Analyzing the interviews conducted in this study, we were able to map teachers’ statements to three of ISTE dimensions: designer, analyst, and facilitator. We were unsuccessful in finding statements that referred to the other four dimensions.
Designer. Recall that this dimension refers to the design of authentic, learner-driven activities, and environments that recognize and accommodate learner variability. Under this dimension, participants mostly referred to the accommodation of learner variability based on insights gained from examining the information presented to them. Commonly, teachers suggested to divide the class into groups, based on knowledge level: “I would divide the kids according to the tasks...and after that I would build the groups” (T5); “I am applying differential instruction. I am taking each group according to their knowledge, according to their presented points, and I am teaching them accordingly [...] promoting them or strengthening them according to their needs” (T4); “Here [table] I know which groups to create and give them tasks according to their success or un-success” (T8).
Some teachers referred specifically to those students who seemed to be struggling the most, differentiating them from the rest of the class, and focusing on the ways they could be assisted and supported, for example, by clarifying the tasks to them, giving them individual lessons, extra exercises, and extraordinary attention: “First, I think to explain the tasks [to the struggling students]. There seems to be some misunderstanding of the tasks [among them]” (T7); “So, it is worth one or two individual hours for those children who have difficulties with [the subject]” (T1); “Working individually [with the struggling students], or in a group during class, or as an extra practice” (T9); “[There are] children who need more support and more help, so that I will keep an eye on them, and I will notice them more, so I can see if they get along” (T3).
Some teachers referred to instructional design principles regarding the struggling students, mostly by creating a personal work plan that is based on “checking the questions that were there” (T5) in order to support “students who need reinforcement” (T6).
On the other side of the scale, and to the least extent, some teachers referred to supporting those students who seem to be excelling by supplying them with challenging tasks. Some ideas on that directions include: “Giving them extra tasks in the classroom, like riddles, more challenging tasks, higher level tasks” (T1); “There are many [students] who scored many points in a short time. It means that we can challenge them with extra tasks or raise the level of difficulty” (T9); and “[This student], scored excellent grades in 3 out of 5 tasks, maybe it required out-of-the-box thinking, so I will give him challenging tasks” (T2).
Alongside the reference to the two extremes, teachers also referred to the class’ overall knowledge level and suggested instructional principles that mainly aim at the average, mostly by adding more class-time on topics with which the majority of the class struggled, and implementing instructional intervention: “If more than half of the class does not know a particular topic, I would repeat it in another way, with the entire class." (T5); “The topics with the lowest number of children [achieving proficiency]: “circle,” “calculate volume,” “calculate area” - I would teach and repeat it in the class, because most of the class does not know it, half of the class” (T4); “On less successful topics, I would re-teach or re-practice... repeating the basics with them” (T9); "I would review task number four and would try to figure out what is that task. Then I would teacher that material using questions with the same style" (T3).
Analyst. This dimension refers to teachers’ use of data as a driving force of their instruction. Indeed, teachers were appreciative of the data-driven insights: “A child that does not like to work in the classroom gets [a full score] on a task. [The dashboard] reveals another aspect of the child, which we do not always see” (T6); “It adds to the understanding of what you do not see during lessons, and then, when you actually get the data at home, you can manage and process it correctly” (T9); “The table clearly presented the students’ skills, and how you as a teacher can strengthen and give feedback to specific children” (T2).
Furthermore, examining the data presented to them, teachers were able to identify necessary assessment components: “If I want to build a formative assessment for a student, I must use this table” (T5).
Others suggested additional, more fine-grained student evaluation: “I would take the topics and make a summary table to see which topics are well understood, and which topics I should strengthen” (T2); “I could map out the students’ skills” (T3).
Some of the teachers explicitly mentioned how data would help them to communicate with students and parents to encourage student ownership of their learning: “I need to know in which tasks the student struggled, because when I talk to a parent or with another teacher, I need a very accurate picture of the child” (T8); “[Using the dashboard I can] ask the child: why didn’t you do the task? Where did you struggle?” (T6); “I saw that [the student] did [the task] quick and that he was wrong. I would talk to him about it, and I would try to direct him so that he will do it more slowly” (T9):
When you see data on a child [regarding the table], you can see his status and reflect that to him. You can show him—in that topic you are strong—empowering him; in that topic you are weak, how can I help you? how can I promote you? It gives you an option to a dialogue with the student (T7).
Facilitator. In line with this dimension, a few teachers were able to suggest ways of facilitating learning with technology to support students’ meaningful learning. For example, they suggested using “visual [aids] and games, all sorts of things that could give the child a comfortable place” (T7), or “doing it digitally, say with [online] games or things like that, and I can do it with worksheets, and flashcards” (T8).
In this paper, we reported on two complementary studies of the role of education dashboards by teachers in their professional development. We refer to “professional development” in a very broad sense, as a life-long endeavor that takes place throughout the teacher’s career and relates to her or his professional and personal lives at large. In many ways, our two studies complement each other, as findings from our qualitative study (N=9) shed light on those from the quantitative study (N=52), and the quantitative study helps us emphasize the more prominent findings from the qualitative study.
Overall, the studies reported here suggest that teachers’ experience with education dashboards may positively contribute to the extent to which they grow professionally as facilitators, analysts, and designers, as defined by ISTE Standards for Educators. While the quantitative findings emphasize the associations with the facilitator and analyst dimensions, the qualitative findings support the contribution to the designer and analyst dimensions, and to a lower extent, the facilitator dimension. From the similarities and differences between the findings from these two studies, we would like to highlight some important issues.
First, education dashboards may indeed support teachers’ decision-making, hence their professional growth, regarding teaching in the traditional sense. The impact on the dimensions of designer and facilitator is well understood, as education dashboards usually present teachers with information on students’ learning vis-à-vis the students’ content understanding. Note that of the seven dimensions defined in the Standards for Educators, these two are the ones that directly relate to the traditional teachers’ responsibilities, that is, to her or his teaching content in the classroom. So, it is of no surprise that the current findings reinforce previous studies in that sense (Molenaar & Knoop-van Campen, 2018; Schifter, 2014; Xhakaj et al., 2016). Indeed, when teachers think of their needs from the "ultimate" dashboard, they usually think of it as augmenting their traditional teaching (Holstein, McLaren, & Aleven, 2017).
Second, the positive impact on teachers’ sense of being an analyst is worth highlighting. Data literacy has been mentioned as an important skill for today’s educators (Mandinach & Gummer, 2013), and it was shown that data-related interventions may improve this skill (Reeves & Honig, 2015). We showed that the very use of data-intensive digital platform may improve teachers’ data literacy. Of course, this finding does not underestimate or undermine such interventions, but rather emphasizes the importance of authentic, routinely, long-lasting usage of data.
Finally, that we did not observe an impact of the use of education dashboards on the other dimensions—namely, learner, leader, citizen, and collaborator—may be an evidence to the yet unfulfilled potential of education dashboards as a means for teachers’ professional development on a broad level. This may be a result of either a design issue or lack of training (or both). In order to enhance the effectiveness of the use of education dashboard by teachers, it is also recommended to design them according to teachers’ needs (Demmans Epp, Phirangee, & Hewitt, 2019), to train teachers on the use of data for their professional use, and to supply them with ongoing support on that topic (Rienties et al., 2018). We plan to continue studying the ways in which education dashboards could help in promoting teachers professionally, to make this decision-supporting tool as effective as possible in all aspects of teaching and learning.
This study is, of course, not without limitations. First, it was situated in a single country, characterized by a specific culture of education, technology, and implementing technology in schools; more than that, it is limited to a particular sub-population (elementary school teachers, mostly women, teaching primarily mathematics), which may have unique characteristics. Therefore, our findings should be validated by similar studies in other disciplines and in other countries. Additionally, the sampled population is not to be considered as representing the whole teacher population in the discipline/country discussed here. Despite these limitations, we feel that the contribution of the current study is of importance for promoting a more effective use of education dashboards, and to enhance teacher training and teachers’ professional development on that topic.
This work was supported by the Israeli Ministry of Education, under the grant Integrating Mathematical Applets in the Teaching Sequence.
Allen, I. E., & Seaman, J. (2017). Digital learning compass: Distance education enrollment report 2017. Babson Survey Research Group. https://doi.org/10.1108/IJEM-02-2014-0018
Annerstedt, C., & Larsson, S. (2010). ‘I have my own picture of what the demands are...’: Grading in Swedish PEH — problems of validity, comparability and fairness. European Physical Education Review, 16(2), 97-115. https://doi.org/10.1177/1356336X10381299
Avidov-Ungar, O. (2016). A model of professional development: teachers’ perceptions of their professional development. Teachers and Teaching, 22(6), 653-669. https://doi.org/10.1080/13540602.2016.1158955
Charleer, S., Klerkx, J., Duval, E., De Laet, T., & Verbert, K. (2016). Creating effective learning analytics dashboards: Lessons learnt (pp. 42-56). In K. Verbert M. Sharples & T. Klobučar (Eds.) Adaptive and adaptable learning, Springer, Cham. https://doi.org/10.1007/978-3-319-45153-4_4
Collinson, V., Kozina, E., Kate Lin, Y. H., Ling, L., Matheson, I., Newcombe, L., & Zogla, I. (2009). Professional development for teachers: A world of change. European Journal of Teacher Education, 32(1), 3-19. https://doi.org/10.1080/02619760802553022
Danielson, C. (2011). Enhancing Professional Practice (2nd ed.). Association for Supervision and Curriculum Development. Received from http://www.ascd.org/Publications/Books/Overview/Enhancing-Professional-Practice-A-Framework-for-Teaching-2nd-Edition.aspx
Darling-Hammond, L., & McLaughlin, M. W. (1995). Policies that support professional development in an era of reform. Phi Delta Kappan, 92(6), 81-92. https://doi.org/10.1177/003172171109200622
Demmans Epp, C., Phirangee, K., & Hewitt, J. (2019). User-centered dashboard design: Iterative design to support teacher informational needs in online learning contexts. American Educational Research Association Annual Meeting. Toronto: Canada. Received from https://www.researchgate.net/publication/332380972
Ez-zaouia, M., Tabard, A., & Lavoué, E. (2020). EMODASH: A dashboard supporting retrospective awareness of emotions in online learning. International Journal of Human Computer Studies, 139, 102411. https://doi.org/10.1016/j.ijhcs.2020.102411
Faria, A.-M., Greenberg, A., Meakin, J., Bichay, K., & Heppen, J. (2014). Replicating the relationship between teachers’ data use and student achievement: The urban data study and the data dashboard usage study. Society for Research on Educational Effectiveness, 1-8. Retrieved from https://files.eric.ed.gov/fulltext/ED562866.pdf
Ferreira, J., Ryan, L., & Tilbury, D. (2007). Mainstreaming education for sustainable development in initial teacher education in Australia: a review of existing professional development models. Journal of Education for Teaching, 33(2), 225-239. https://doi.org/10.1080/02607470701259515
Gillet, D., Holzer, A., Schwendimann, B. A., Boroujeni, M. S., Vozniuk, A., Prieto, L. P., & Rodríguez Triana, M. J. (2017). Monitoring, awareness and reflection in blended technology enhanced learning: A systematic review. International Journal of Technology Enhanced Learning, 9(2/3), 126. https://doi.org/10.1504/ijtel.2017.10005147
Grossi, M. G. R., Oliveira, E. S., Barbosa, A. C., & Oliveira, P. H. de. (2016). People with disabilities and the formation of the basic education teacher: A study of Brazilian reality. Journal of Education and Human Development, 5(4), 2334-2978. https://doi.org/10.15640/jehd.v5n4a14
Lang, C., Siemens, G., Wise, A., & Gašević, D. (Eds.) (2017), Handbook of learning analytics. Society for Learning Analytics Research (SoLAR). https://doi.org/10.18608/hla17
Hargreaves, A. (2005). Educational change takes ages: Life, career and generational factors in teachers’ emotional responses to educational change. Teaching and Teacher Education, 21(8), 967-983. https://doi.org/10.1016/j.tate.2005.06.007
Hay, P. J., & Macdonald, D. (2008). (Mis)appropriations of criteria and standards‐referenced assessment in a performance‐based subject. Assessment in Education: Principles, Policy & Practice, 15(2), 153-168. https://doi.org/10.1080/09695940802164184
Hershkovitz, A. & Karni, O. (2018). Borders of change: A holistic exploration of teaching in one-to-one computing programs. Computers & Education, 125, 429-443.
Hershkovitz, A., Merceron, A., & Shamaly, A. (2019). The role of pedagogy in one-to-one computing lessons: a quantitative observational study of teacher-student interactions. Revista Española de Pedagogía, 77(274), 487-515.
Holstein, K., McLaren, B. M., & Aleven, V. (2017). Intelligent tutors as teachers’ aides. Proceedings of the Seventh International Learning Analytics & Knowledge Conference on - LAK ’17, 257-266. https://doi.org/10.1145/3027385.3027451
Hsieh, H.-F. & Shannon, S.E. (2005). Three approaches to qualitative content analysis. Qualitative Health Research, 15(9), 1277-1288.
Hung, M.-L. (2016). Teacher readiness for online learning: Scale development and teacher perceptions. Computers & Education, 94, 120-133. https://doi.org/10.1016/J.COMPEDU.2015.11.012
Khan, M., & Khan, S. (2011). Data and information visualization methods, and interactive mechanisms: A survey. International Journal of Computer Applications, 34(1), 1-14. https://doi.org/10.5120/4061-5722
Light, D., Wexler, D. H., & Heinze, J. (2005). Keeping teachers in the center: A framework for data-driven decision-making. Proceedings of Society for Information Technology & Teacher Education International Conference 2005, Secada 2001, 128-133. Retrieved from https://www.learntechlib.org/primary/p/18964/
Mandinach, E. B. (2012). A perfect time for data use: using data-driven decision making to inform practice. Educational Psychologist, 47(2), 71-85. https://doi.org/10.1080/00461520.2012.667064
Mandinach, E. B., & Gummer, E. S. (2013). A systemic view of implementing data literacy in educator preparation. Educational Researcher, 42(1), 30-37. https://doi.org/10.3102/0013189X12459803
Mann, H. B., & Whitney, D. R. (1947). On a test of whether one of two random variables is stochastically larger than the other. The Annals of Mathematical Statistics, 18(1), 50-60. https://doi.org/10.1214/aoms/1177730491
Tissenbaum, Matuk, C., M., Berland, M., Lyons, L., Cocco, F., Linn, M., ... & Dillenbourg, P. (2016). Real-time visualization of student activities to support classroom orchestration (symposium). In C.-K. Looi, J. Polman, U. Cress, & P. Reimann (eds.), Transformin learning, empowering learners: The international conferences of the learning sciences: Volume 2 (pp. 1120-1127). Singapore: International Society of the Learning Sciences. https://www.isls.org/icls/2016/docs/ICLS2016_Volume_2.pdf
Molenaar, I., & Knoop-van Campen, C. (2018). How teachers make dashboard information actionable. IEEE Transactions on Learning Technologies, 12(3), 347-355. https://doi.org/10.1109/TLT.2018.2851585
Nabhani, M., & Bahous, R. (2010). Lebanese teachers’ views on “continuing professional development.” Teacher Development, 14(2), 207-224. https://doi.org/10.1080/13664530.2010.494502
Reeves, T. D., & Honig, S. L. (2015). A classroom data literacy intervention for pre-service teachers. Teaching and Teacher Education, 50, 90-101. https://doi.org/10.1016/J.TATE.2015.05.007
Richardson, J. W., McLeod, S., Flora, K., Sauers, N. J., Kannan, S., & Sincar, M. (2013). Large-scale 1:1 computing initiatives: An open access database. International Journal of Education and Development Using Information and Communication Technology, 9(1), 4-18. https://doi.org/http://ijedict.dec.uwi.edu/
Rienties, B., Herodotou, C., Olney, T., Schencks, M., & Boroowa, A. (2018). Making sense of learning analytics dashboards: A technology acceptance perspective of 95 teachers. International Review of Research in Open and Distance Learning, 19(5), 187-202. https://doi.org/10.19173/irrodl.v19i5.3493
Schifter, C. et al. (2014). Data-driven decision making: Facilitating teacher use of student data to inform classroom instruction. Contemporary Issues in Technology and Teacher Education, 14(4), 419-432. Retrieved from https://www.learntechlib.org/p/148436/
Schwendimann, B. A., Rodríguez-Triana, M. J., Vozniuk, A., Prieto, L. P., Shirvani Boroujeni, M., Holzer, A., ... & Dillenbourg, P. (2017). Perceiving learning at a glance: A systematic literature review of learning dashboard research. IEEE Transactions on Learning Technologies, 10(1), 30-41. https://doi.org/10.1109/TLT.2016.2599522
Tissenbaum, M., & Slotta, J. (2019). Supporting classroom orchestration with real-time feedback: A role for teacher dashboards and real-time agents. International Journal of Computer-Supported Collaborative Learning, 14(3), 325-351. https://doi.org/10.1007/s11412-019-09306-1
Trust, T. (2018). 2017 ISTE Standards for educators: From teaching with technology to using technology to empower learners. Journal of Digital Learning in Teacher Education, 34(1), 1-3. https://doi.org/10.1080/21532974.2017.1398980
Vanlommel, K., Van Gasse, R., Vanhoof, J., & Van Petegem, P. (2017). Teachers’ decision-making: Data based or intuition driven? International Journal of Educational Research, 83, 75-83. https://doi.org/10.1016/J.IJER.2017.02.013
Wishart, J. (2017). Mobile learning in schools. In J. Wishart (Ed.) Mobile learning in schools. London, Routledge. https://doi.org/10.4324/9781315536774
Xhakaj, F., Aleven, V., & McLaren, B. M. (2016). How teachers use data to help students learn: Contextual inquiry for the design of a dashboard. Lecture Notes in Computer Science (Including Subseries Lecture Notes in Artificial Intelligence and Lecture Notes in Bioinformatics), 9891 LNCS, 340-354. https://doi.org/10.1007/978-3-319-45153-4_26
Xhakaj, F., Aleven, V., & McLaren, B. M. (2017). Effects of a teacher dashboard for an intelligent tutoring system on teacher knowledge, lesson planning, lessons and student learning. Lecture Notes in Computer Science (Including Subseries Lecture Notes in Artificial Intelligence and Lecture Notes in Bioinformatics), 10474 LNCS, 315-329. https://doi.org/10.1007/978-3-319-66610-5_23
Yoo, Y., Lee, H., Jo, I. H., & Park, Y. (2015). Educational dashboards for smart learning: Review of case studies. In G. Chen, V. K. Kinshuk, R. Huang, & S. C. Kong (Eds.), Lecture Notes in Educational Technology (Issue 9783662441879, pp. 145-155). Springer-Verlag. https://doi.org/10.1007/978-3-662-44188-6_21
Yurtseven Avci, Z., & O’Dwyer, L. (2016). Effective technology professional development: A systematic review. Society for Information Technology & Teacher Education International Conference, 2016(1), 2455-2460. Retrieved from https://www.learntechlib.org/p/172038/

Teachers' Use of Education Dashboards and Professional Growth by Shiran Michaeli, Dror Kroparo, and Arnon Hershkovitz is licensed under a Creative Commons Attribution 4.0 International License.