
Jon Baggaley, Athabasca University – Canada's Open University
Batchuluun Batpurev, Infocon Ltd.
Mongolia
Jim Klaas, DevEd International
Canada
In the previous report in this series, Web browser loading times were measured in 12 Asian countries, and were found to be up to four times slower than commonly prescribed as acceptable. Failure of webpages to load at all was frequent. The current follow-up study compares these loading times with the complexity of the Internet routes linking the Web users and the Web servers hosting them. The study was conducted in the same 12 Asian countries, with the assistance of members of the International Development Research Centre’s PANdora distance education research network. The data were generated by network members in Bhutan, Cambodia, India, Indonesia, Laos, Mongolia, the Philippines, Sri Lanka, Pakistan, Singapore, Thailand, and Vietnam. Additional data for the follow-up study were collected in China. Using a ‘traceroute’ routine, the study indicates that webpage loading time is linked to the complexity of the Internet routes between Web users and the host server. It is indicated that distance educators can apply such information in the design of improved online delivery and mirror sites, notably in areas of the developing world which currently lack an effective infrastructure for online education.
The previous paper in this series reported two studies examining the amount of time taken to load different types of webpages in the Internet Explorer Web browser. The first study involved 31 members of the PANdora distance education (DE) research network in 12 Asian countries. The second study compared the loading times reported by 41 educators in Mongolia. Both studies found that webpages created using the common programming method of combined HTML and PHP coding took, on the first check, 10-19 seconds to load in the browser. Pages delivered by the widely used Moodle LMS took up to 39 seconds to load. Such speeds are four times slower than the 10-second benchmark recommended in Web design since the mid-1990s (Nielsen, 2007). It was concluded that if such benchmarks are not heeded in the development of online materials, the World-Wide Web is likely to become increasingly inaccessible as a viable educational medium, particularly in the developing world.
Numerous factors can be responsible for slow browser loading times. In the
preceding studies, the use of low-level computers or poor dial-up internet connections
was discounted owing to the up-to-date facilities of the studies’ respondents.
Traffic congestion on the institutional networks used by many of the respondents,
and the long client-server distances between the Asian countries involved in
the study, may have been contributing factors. In addition, while some users
may have received the Web displays via straightforward Internet routes using
minimal junction points, others may have received them via complex, tortuous
international routes. The current study re-examines the data reported in the
previous article, in light of this hypothesis.
The complexity of routes taken by a signal on the Internet can be identified
by the ‘traceroute’ procedure included in most computer operating
systems (Moss, 1997). The analyst submits the domain name or Internet Protocol
(IP) address of a remote computer/ Web server to the traceroute routine. At
any given time, each computer on the Internet has an unique IP address, shared
by no other computer. The address consists of four numbers ranging from 0 to
255, each separated by a dot (e.g., 146.23.12.200). The traceroute procedure
analyses the signal’s route from the originating computer to the remote
one, in terms of the number of ‘hops’ the signal takes through separate
servers, the time in milliseconds taken at each hop. The IPs and/ or domain
names, and the geographical locations of each computer in the route, are also
identified.
In order to determine whether the browser loading speeds observed in the previous study may have been affected by the routing complexity from the user’s computers to the PANdora Web server in Pakistan, the IP addresses of each participant in Study A were collected. These were available in the log files of the server in Mongolia on which the responses had been collected. Traceroutes were then conducted from the webpages’ host server at the Virtual University of Pakistan to each of the 31 participants’ computers. For each traceroute result, the number of hops from the Pakistan server to each computer was recorded. As the standard traceroute procedure sends three successive signals to each server en route to the target computer, the average length of time (milliseconds) taken at each hop was recorded. It was also noted whether or not the traceroute succeeded in locating the target computer or was abandoned after the pre-configured ‘time-out’ interval (three minutes). Since IP addresses may change between Internet sessions, with a resulting change in the last of the four sections in the address, a trace of the target computer was identified as successful when the IP recorded at the end of the traceroute sequence included the first three sections of the target IP. The geographical locations of each computer in the route was identified by the reverse lookup procedure.
In addition to the 31 ‘traces’ conducted from the Pakistan server to the users’ computers, the Web addresses of the users’ 14 institutions were also submitted to the traceroute routine (i.e., 45 commands in all). As an individual traceroute command can take several minutes, a program was written to conduct all 45 traceroutes via a single command. The standard traceroute default values were used for the maximum number of hops at each stage of the route, and for the three-minute maximum for measuring individual hops. The program was made available for download and use in the Windows operating system by researchers across the PANdora Asian network. To this point, the 45 traceroutes have been run from Lahore (Pakistan), Phnom Penh (Cambodia), Ulaanbaatar (Mongolia), and from sites in Canada. Data collection from all these sources took place during a weekday morning (local time in each city) from May 10-14, 2007.
The analysis indicates that the Internet routes taken by Web materials to the users’ computers range from the simple to the exceedingly complex. Figure 1 illustrates three of the most simple routes noted in the traceroute analysis between the PANdora Web server and its users across Asia.
In countries such as Mongolia, which lack a comprehensive internet infrastructure, the traceroutes can be more complex. Figure 2 illustrates the routes taken between the Lahore, Pakistan server and Ulaanbaatar, Mongolia, as an 11-hop process through Islamabad and Singapore. The traceroutes conducted from Ulaanbaatar to Lahore reveal an even more complex return route (16 hops) though Tomsk (Russia), Stockholm (Sweden), Rome (Italy), and Islamabad (Pakistan).
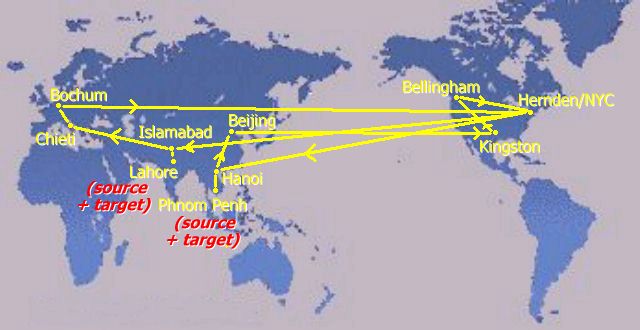
Another country with a relatively undeveloped Internet infrastructure is Cambodia. Figure 3 illustrates the return routes between the PANdora Web server in Pakistan and the Cambodian capital, Phnom Penh. It is a route almost too tortuous to display in a single figure. The outward route from Lahore to Phnom Penh (13 hops) goes through Islamabad, Chieti (Italy), Bochum (Germany), Hernden (USA), and Hanoi (Vietnam). The traceroute data collected in Phnom Penh reveal an even more complex 19-hop return route from Phnom Penh to Lahore via Hanoi, Beijing, the US states of Oklahoma, Washington, New York, and Islamabad.
Figure 1. Three direct routes: 1) Lahore to Islamabad; 2) Phnom Penh to Phnom Penh (via Hanoi); 3) Beijing to Ulaanbaatar (via Virginia, USA)
Figure 2. The routes between Lahore and Ulaanbaatar (outward via Islamabad and Singapore; return via Tomsk, Stockholm, Rome, and Islamabad)
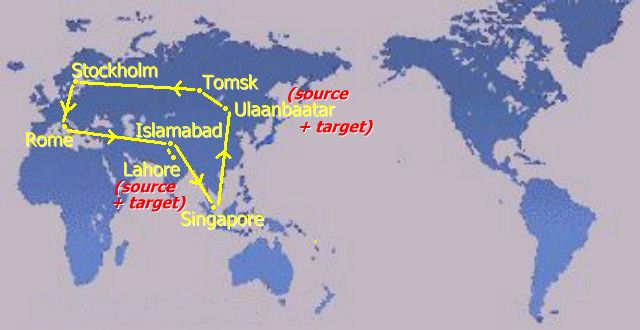
Figure 3. The routes between Lahore and Phnom Penh (outward via Islamabad, Chieti, Bochum, Virginia and Hanoi; return via Hanoi, Beijing, the US states of Oklahoma, Washington, and New York, and Islamabad)
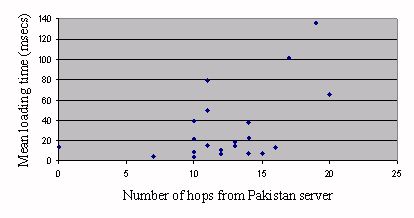
The final analysis examined whether the traceroute complexity between the Pakistan Web server and its users is related to the browser loading times reported in Study A. The respondents’ mean loading times across the five Web displays were calculated and compared with the number of hops from the Pakistan server to the respondents’ computers. With only one outlying score, two clusters of scores are noted (see Figure 4). The first cluster involves relatively few hops (1-16) and is related to fast loading times (50 milliseconds or less). The second involves the maximum number of hops (19-20 in the current study) and slow loading times of 60-136 milliseconds.
Figure 4. Browser loading speed versus server hops
Despite the above relationship between mean loading time and number of hops, no systematic relationship was observed between the loading times and the actual times taken by the traceroute routine at successive hops. Numerous traceroutes in the study failed to locate their targets at all, probably because of blocks placed upon incoming traceroute requests by the target networks. No reliable generalizations can be made on this in the absence of tests between every institution in the network. Other factors affecting the results may have included packet loss, latency, and the use of the default traceroute setting for the maximal time allowed for measuring each hop. Further studies should be conducted to determine more reliable criteria for hop measurement in specific situations.
Despite the shortcomings of the traceroute measurement method, the follow-up study has yielded promising evidence linking the complexity of Internet routes to the slow webpage loading times observed in the previous two studies. Geographical distance bears no relation to traceroute complexity, for signals between cities relatively close to one another (e.g., Lahore and Islamabad, Beijing and Ulaanbaatar) can traverse several continents before finally reaching their targets. Even signals between computers in the same city (e.g., Phnom Penh in Cambodia) are routed through Vietnam. The reasons for a complex Internet routing have more to do with the availability of adequate routes in the region. Traceroute analyses reveal the need for new Internet routes and Internet Exchange Points (IXPs) in specific geographical areas, and also demonstrate the locations (e.g., Singapore and Hanoi) currently acting as major hubs for Asian Internet traffic. Educational institutions wishing to improve the efficiency of their online communications can use this information in establishing mirror Web servers.
Although well known to computer specialists, such network analysis methods are relatively unfamiliar to educators. In order to overcome the current inaccessibility of Web materials in developing countries (i.e., slow loading times of browser-based courseware, unreliable email delivery, etc.), distance educators should study such data in order to identify constantly evolving solutions. The next report in this series will analyse the relative efficiency of online communications among the 12 Asian countries in the PANdora network, and between the network’s major open learning institutions.
For advice and assistance in this study, the authors are grateful to their colleagues across the PANdora research network, to Jon Hamel for programming input, Ehsen Puri, Network Executive at the Virtual University of Pakistan, and Steve Song, Manager of the IDRC’s ICT4D Africa Programs. Map template used with permission, courtesy of http://www.theodora.com/maps/. The project was conducted with financial support from the Pan Asia Networking (PAN) Program Initiative of the International Development Research Centre (IDRC), under a grant to the Virtual University of Pakistan (VUP) for the project ‘PANdora: Distance and Open Resource Access.’
Moss, J. (1997). Understanding TCP/IP, Part 1. Article published on the PC Support Advisor website. Retrieved May 22, 2007 from: http://www.pcsupportadvisor.com/c04100.htm
Nielsen, J. (2007, March 1). The need for speed. Article published on useit.com:
Jakob Nielsen's Website. Retrieved April, 22, 2007 from: http://www.useit.com/alertbox/9703a.html
N.B. Owing to the speed with which Web addresses are changed, the online references cited in this report may be outdated. They can be checked at the Athabasca University software evaluation website: http://cde.athabascau.ca/softeval/. Italicised product names in this report can be assumed to be registered trademarks.
JPB Editor, Technical Evaluation Reports.