Jon Baggaley, Athabasca University – Canada's Open University
Batchuluun Batpurev, Infocon Ltd., Mongolia
Two studies are reported, comparing the browser loading times of webpages created using common Web development techniques. The loading speeds were estimated in 12 Asian countries by members of the PANdora network, funded by the International Development Research Centre (IDRC) to conduct collaborative research in the development of effective distance education (DE) practices. An online survey tool with stopwatch-type counter was used. Responses were obtained from Bhutan, Cambodia, India, Indonesia, Laos, Mongolia, the Philippines, Sri Lanka, Pakistan, Singapore, Thailand, and Vietnam. In most of the survey conditions, browser loading times were noted up to four times slower than commonly prescribed as acceptable. Failure of pages to load at all was frequent. The speediest loading times were observed when the online material was hosted locally, and was created either in the Docebo learning management system (LMS), or in the HTML option provided by the Moodle LMS. It is recommended that formative evaluation of this type should become standard practice in the selection and use of online programming techniques, in order to preserve the accessibility of the World-Wide-Web across large geographical distances, as for DE in the developing world.
In creating numerous educational websites since 1996, in Canada and Mongolia, the authors have noted the increasing time taken by standard Web browsers in loading webpages. The early Web programming techniques (basic HTML code, frames, etc.) generated displays that were relatively swift to access, for with each new display the material in unchanged frames did not need to be reloaded. The disadvantage of the frames technique, however, was that, if poorly used, it could make browser navigation difficult. It also made the overall display inaccessible to users whose poor sight obliged them to use text-based browsers, and leading analysts of Web design such as Nielsen (1996) deemed the frames technique user-unfriendly for this reason. By 1999, Nielsen had relaxed his negative attitude to frames owing to improvements made in the Internet Explorer 5 and Netscape Navigator 4 browsers. The stigma associated with frames stuck, however, and new programming methods (PHP, etc.) have since taken their place. These have overcome many of the early usability problems, though often with a related increase in the speed with which the browser loads the page.
On the question of browser page loading speed, Nielsen’s (1994: 1997) advice has been consistent from the mid-1990s to the present day:
"10 seconds is about the limit for keeping the user's attention focused on the dialogue. For longer delays, users will want to perform other tasks while waiting for the computer to finish, so they should be given feedback indicating when the computer expects to be done. Feedback during the delay is especially important if the response time is likely to be highly variable, since users will then not know what to expect" (Nielsen, 1994, ¶ 4).
Since 2006, the authors have collaborated in the development and maintenance of a website designed as an information and communication portal for a distance education (DE) research network across Asia. At the time of testing, the PANdora network (www.pandora-asia.org) comprised of 20 educational and government institutions in 12 countries, collaborating on nine research projects funded by the International Development Research Centre (IDRC). The network’s website features details of the projects and the teams conducting them, announcements about publications, conference presentations, etc., and a private members’ section containing downloadable papers and research materials, and streamlined access to text- and audio-conference software. As many of the PANdora projects concern the development of online course material, a series of leading learning management systems (LMS) is available on the site for researchers to evaluate; and one project, conducted in Mongolia by the second author, has formally tested eight of these packages with students, teachers, and administrators. The results of that study have led several of the project teams to adopt (as at the first author’s university) Moodle, an LMS based on open-source software (OSS).
In using Moodle and other LMS systems among the Asian network’s 12 countries, however, their slow loading speed in the standard Web browsers has commonly been noted. Several PANdora project teams have mentioned this as a serious deterrent to Web use in Asian education (Amarsaikhan, Lkhagvasuren, Oyun, & Batpurev, 2007; Jamtsho & Bullen, 2007; Ramos, Nangit, Ranga, & Triñona, 2007), and have attributed it to factors including congestion on the networks of the users’ educational institutions, and the slow domestic dial-up connections of some users. Increasing demands of software upon Internet bandwidth of this type have been dubbed “bandwidth creep”, predicted by Maney (2001) to become a significant and source of frustration for Internet users. Since the PANdora researchers are expected, at the end of the project’s 2005-2008 duration, to present practical recommendations for the use of DE technologies across Asia, slow access to Web materials has been judged sufficiently serious for a formal examination of the browser speeds associated with different Web programming techniques. The current report presents the early findings of this study.
The PANdora website is hosted on a fast server at the network’s administrative centre, the Virtual University of Pakistan (VUP). The network researchers are required to access the site in their international collaboration, and to obtain up-to-date information on network developments. The first study took advantage of the members’ wide-ranging geographical dispersal across Asia to compare the lengths of time it took their browsers to load a series of Web displays. The homepage and announcements page of the network’s website at www.pandora-asia.org were used as the test displays, coded in five alternative ways:
An online survey was created in HTML and javascript, containing 15 questions about the user’s location and technical facilities, and 10 items designed to test browser loading speed. The survey and the test pages were all hosted on the VUP server in Lahore. The server’s technical specifications were as follows:
- Product name and manufacturer: Headon/ Intel
- Processor: Intel P4 3.0Ghz
- Chipset: Intel D845 GERG2
- Memory (size, speed and type): 512MB; 266MHz; DDR
- Operating system: Fedora Core 4
- Storage (size, type and RPM): 80GB; IDE interface; 7200RPM
- Communications (LAN card): 100Mbps
The server’s software platform was:
- Web server: Apache 2.0.52
- Database server: MySQL 11.18; Distribution 3.23.58 for Redhat Linux-gnu (i386)
- PHP 4.3.9
The participants were instructed to respond to the survey in their Internet Explorer browser. On an average Internet connection, the survey took 20-30 minutes to complete. Respondents for whom webpages failed to load typically took up to 10 minutes longer.
The browser loading speeds were measured using a stopwatch-style counter programmed in javascript, and embedded in the survey instrument. The test was preceded by instructions to configure the browser to load each page from the server every time it was requested, and to clear the browser’s cache memory before accessing the page. Instructions on how to complete these browser configurations were provided, and thumbnail images of the five displays were presented as they would appear when fully loaded. In each test item, a link was provided to the page to be tested, which opened in a separate window. The respondents were asked to enter into the response box the amount of time (in milliseconds) that each page took to load. The test of the five displays was conducted twice in order to measure possible improvements due to the pages’ retention in memory on the Internet provider’s Web server. Before the second set of five test items, the respondents were asked to repeat the two browser configurations. If a page did not load within three minutes (180 seconds) on a given test, the respondents were instructed to enter "time out" as the response. When the task was complete, the respondents pressed a ‘Submit’ button to send them to a server at Infocon Ltd. in Ulaanbaatar, Mongolia.
A pilot test was conducted (October - November 2006) in order to refine this procedure and clarify its instructions. Fourteen (n = 14) network members in eight countries assisted in the pilot, and provided the researchers with suggestions for optimising the procedure.
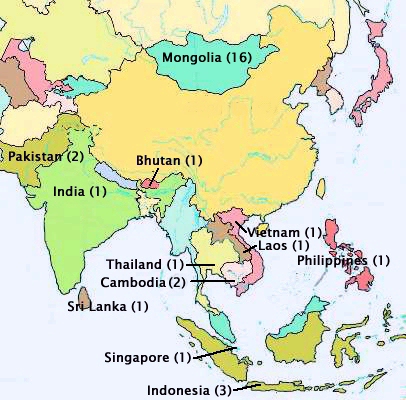
The formal test was completed in January/ February 2007 by 31 network members in 12 Asian countries (Figure 1). Their responses showed that 81 percent of them used a Pentium-4 computer in their regular work, with Windows XP (94%), Internet Explorer v5 or v6 (77%), a RAM size of 512 mb or greater (45%), and a display size of at least 1024 x 768 (74%). The majority (77%) used broadband Internet connections > 64 kps, as opposed to dial-up. They reported using a wide range of anti-virus software including Avast, AVG, Bit Defender, McAfee, and Norton; only 16 percent stated that they did not have anti-virus software or did not know if they had it. The sample was less informed about the privacy protection software on their computers: 71 percent either did not answer this question, or stated that they did not have such software, or that they did not know if they had it. The other 29 percent mentioned using a wide range of firewall and spyware software. The sample’s most common e-mail software was Microsoft Outlook or Outlook Express (77%). Twenty-two (n = 22) persons reported using Yahoo instant messenger (71%). The most common problem reported with the PANdora website was its loading speed (45%).
Figure 1. Number of respondents in each country (Study A)
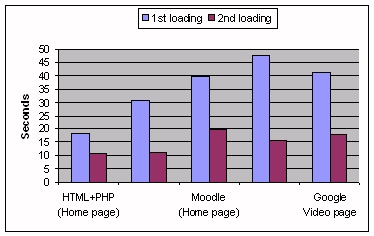
The amount of time (seconds) it took the respondents’ Internet Explorer browser to load each of the five displays is indicated in Figure 2. The number of "time out" responses for each page (i.e., not loaded within three minutes) was divided approximately equally between 5 of the 31 respondents: the 5 individuals failed to load all five of the pages. As these loading failures appeared to arise at the level of the individual respondent rather than in relation to the specific pages, they were discounted in the analysis to avoid giving a falsely negative impression of the pages’ intrinsic loadability. The two pages coded in HTML and PHP were the fastest to load in the first check (19 and 16 seconds respectively, reducing to 11 seconds each in the second check). The Moodle pages took longer to load the first time (39 seconds each), but took only 16-20 seconds on the second loading. The Google Video page initially took 24 seconds, reducing to 18 seconds the second time. The nature of the timing task may have caused participants to over-estimate loading times by a few seconds while they manipulated the on-screen timer’s stop button. Psychophysical error of this type may be assumed constant across the five display categories, however.
Figure 2. Browser loading speeds (Study A)
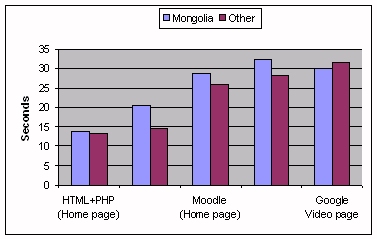
In view of the large number of respondents situated in Mongolia (16/ 31), a comparison was made between their loading speeds and those of the 15 respondents situated elsewhere in Asia (Figure 3). The average of the first and second loading checks on each page was taken for each sub-sample. On four out of five pages, the average loading times in Mongolia were faster (by 4 to 17 seconds) than those reported elsewhere. Failures to load the pages, however, were common among the rural respondents.
Figure 3. Browser loading speeds (Study A): Mongolia versus elsewhere
The large number of Mongolian participants in the study also provided the opportunity to see if they would yield similar results in response to web materials hosted on a Mongolian server. The home page of a web site (www.elearning.mn) hosted by the PANdora partner in Mongolia, was selected for testing. The page was coded in four alternative ways:
The same procedure was used as in Study A. The survey and the test pages were all hosted at Infocon Ltd. in Ulaanbaatar. The server’s technical specifications were as follows:
- Product name and manufacturer: Dell PowerEdge SC1425
- Processors: 2 x Intel Xeon, CPU 3.00GHz, 64 bit, 800MHz FSB, 2MB Cache
- Chipset: Intel E7520
- Memory (size, speed and type): 4 x 512MB; 400MHZ
- Operating system: Fedora Core 5, kernel 2.6.19
- Storage (size, type and RPM): U320 SCSI Fujitsu MAT3073NP, 73GB, 10000 RPM; and U320 SCSI Fujitsu MAT3147NP, 147GB, 10000 RPM
- Communications (LAN card): 2 x Intel PRO/1000, 82541GI/PI GB
The server’s software platform was:
- Web server: Apache 2.2.2
- Database server: Mysql 5.0.27
- PHP 5.1.6
Ninety-two (n = 92) people submitted responses to the online survey (February 2007), including 31 who did not answer the demographic and technical questions, and 20 who did not state their country or who cited countries other than Mongolia. The latter two categories of respondents were eliminated from the sample. The responses of the remaining 41 persons were analysed as in Study A.
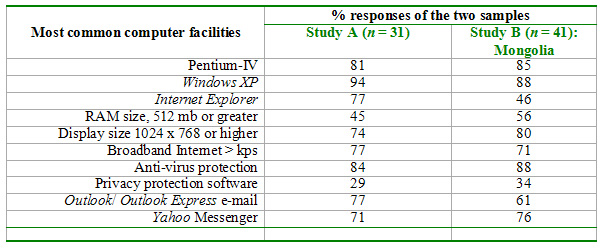
The respondents were primarily situated in urban Ulaanbaatar (93%). Otherwise their most common responses were as in Study A. The majority (85%) used a Pentium-4 computer in their regular work, with Windows XP (88%), Internet Explorer (46%), a RAM size of 512 mb or greater (56%), and a display size of at least 1024 x 768 (80%). The majority (71%) used broadband Internet connections > 64 kps, as opposed to dial-up. They reported using a wide range of anti-virus software including AVG, Bit Defender, Kaspersky, McAfee, and Norton; only 12 percent stated that they did not have anti-virus software or did not know if they had it. The sample was less informed about the privacy protection software on their computers: 66 percent either did not answer this question, or stated that they did not have such software, or that they did not know if they had it. The other 34 percent stated that they use firewall and spyware software, though cited few product names. The sample’s most common email software was Microsoft Outlook or Outlook Express (61%). Thirty-one (n = 31) persons reported using Yahoo instant messenger (76%). The most common problem reported by the sample with the www.elearning.mn portal website was its loading speed (17%).
The hardware and software facilities of the two studies are compared in Table 1. The Mongolian sample uses facilities similar to those most commonly reported by the other respondents, though reports a lower usage of Internet Explorer (46%) owing to a higher usage of Firefox (44%). Both samples show a need for greater use of firewall and spyware software.
Table 1. Computer facilities of the two samples (Studies 1 and 2)
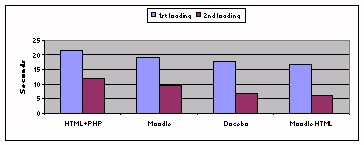
The amount of time (seconds) it took the respondents’ Internet Explorer
browser to load each of the four displays is indicated in Figure 4. Ten
respondents (24%) gave “time out” responses (i.e. not loaded within
3 minutes) for all four displays. For the remaining respondents, the page coded
in HTML and PHP was slower to load (12-14 seconds) than the other pages, though
a slight average increase was noted for all pages when they were loaded the
second time. The Moodle page was faster, at 9-11 seconds. Moodle
HTML and Docebo pages were the fastest to load (9 and 10 seconds respectively,
reducing to 6 and 7 seconds on the second check).
Figure 4. Browser loading speeds (Study B): Mongolia
The two studies showed marked differences between the browser loading times associated with different Web development techniques. In both studies, pages created using the common mixture of HTML and PHP coding took, on the first check, 10-19 seconds to load in an Internet Explorer browser. Pages delivered by the widely used Moodle LMS took up to 39 secs to load. These sluggish speeds are as much as four times slower than the 10-second benchmark adopted in Web design since the mid-1990s (Neilsen, 2007). On the second check, most of the test pages loaded more speedily than the first time, and satisfied this common benchmark. It should be noted, however, that if a page fails to load speedily the first time it is accessed, the user may not try a second time.
The most rapid loading times were those observed in Study B for the pages created in Docebo (7-10 seconds) and for the HTML option provided by Moodle (6-9 seconds). Each of these options, therefore, has advantages for Web delivery over large international distances. The particular popularity of Moodle, however, makes the Moodle/ HTML option the more promising of the two.
The slow loading times may have various explanations. The use of low-level computers or poor dial-up Internet connections can be ruled out as reasons because of the up-to-date facilities reported in both studies. Traffic congestion on the institutional networks used by many of the respondents may certainly have been a factor. The long and varying client-server distances between the Asian countries involved in the studies may also account for the slow loading times. This hypothesis explains the fast loading speeds reported by Mongolian respondents in the second study, who received the online materials from a local server in Ulaanbaatar. In addition, while some users may have received the Web displays via straightforward Internet routes using minimal junction points, others may have received them via complex, tortuous international routes. (The current data will be re-examined in light of this hypothesis in Part 2 of this report.) In hosting educational Web materials for Asian DE, the use of alternative mirror sites is therefore likely to be valuable, reducing the distances and complexity of the Internet routes over which the material is conveyed.
It is worth noting that the second study’s respondents, downloading the materials rapidly from a local Web server, wherein the same privileged situation as those Web designers who download their draft materials rapidly from a server at their workplace. Unless developers test the reception of their materials on the computers that the students use, or ask the students for feedback, they may never experience the lesser convenience of the remote locations. Regrettably, such checks on the usability of Web materials do not appear to be a common procedure in DE, either on the part of the Web developers, the teachers, or the institutions themselves. Consequently, students can suffer extreme delays while their learning materials take up to a minute to load, or fail to load at all. In scanning the many displays in a course website, the busy student can find the constant delays disruptive and intolerable. Assuming the problem to be somehow of their own making, students may fail to report it to the teachers or to the institution’s service staff. As a result, the inaccessibility of Web materials goes unheeded by their producers, and programming techniques become increasingly complex with little or no heed to the fact that their efficiency has decreased in the process. It is ironic that the move away from the old, faster-loading frames method of Web design has benefited some users while creating a new accessibility problem for many others. This is the type of barrier that the open and distance learning movement is mandated to avoid.
Failure to take account of the efficiency of educational materials has been commonplace in educational media production, and formative evaluation methods are a necessary means of quality assurance (Baggaley, 1980). If such pilot-testing procedures are not adopted as standard practice in online education, and the benchmarks offered by analysts such as Nielsen (1994; 1996; 1999; 2007) are not heeded, the World-Wide Web is likely to become increasingly inaccessible and to decline as a viable educational medium, especially across the large distances of the developing world. With each successive upgrade of online software applications, it is vital for their accessibility on standard connections to be checked so that problems of “bandwidth creep” can be avoided.
For assistance in this study, the authors are grateful to their colleagues in the 12 countries of the PANdora research network, to Mr. Ehsen Puri, Network Executive at the Virtual University of Pakistan, and to Steve Song, Manager of the IDRC’s ICT4D Africa Programs. The project was conducted with financial support from the Pan Asia Networking (PAN) Program Initiative of the International Development Research Centre (IDRC), under a grant to the Virtual University of Pakistan (VUP) for the project ‘PANdora: Distance and Open Resource Access.’
Amarsaikhan, D. Lkhagvasuren, T., Oyun, S., & Batpurev, B. (in press). Online medical diagnosis and training in rural Mongolia. Distance Education 28(2).
Baggaley, J. P. (1980). Dynamics of Television. New York: Praeger.
Jamtsho, S., & Bullen, M. (in press). Distance Education in Bhutan: Improving access and quality through ICT use. Distance Education 28(2).
Maney, K. (2001, November 8) Broadband takes off at a snail’s pace. USA Today. Retrieved April 22, 2007 from: www.usatoday.com/tech/bonus/1101/cover.htm
Nielsen, J. (1994). Response Times: The three important limits. Usability Engineering. San Francisco: Morgan Kaufmann Retrieved March 17, 2007 from: www.useit.com/papers/responsetime.html
Nielsen, J. (1996, December). Why Frames Suck (Most of the Time). Article published on useit.com: Jakob Nielsen's Website. Retrieved March 17, 2007 from: http://www.useit.com/alertbox/9612.html
Nielsen, J. (1999, May 2). "Top ten mistakes" revisited three years later. Article published on useit.com: Jakob Nielsen's Website. Retrieved 17 March, 2007 from: http://www.useit.com/alertbox/990502.html
Nielsen, J. (2007, March 1). The need for speed. Article published on useit.com: Jakob Nielsen's Website. Retrieved 17 March, 2007 from: http://www.useit.com/alertbox/9703a.html
Ramos, A.J., Nangit, G., Ranga, A., & Triñona, J. (in press). ICT-enabled community education in the Philippines. Distance Education 28(2).
_________________________
The next report in this series discusses Internet routes.
N.B. Owing to the speed with which Web addresses are changed, the online references cited in this report may be outdated. They can be checked at the Athabasca University software evaluation website: http://cde.athabascau.ca/softeval/. Italicised product names in this report can be assumed to be registered trademarks.
JPB Editor, Technical Evaluation Reports.