
Volume 18, Number 7
Emilio Ferreiro-Lago and Sara Osuna-Acedo
National Distance Education University (UNED)
Today the digital divide is measured not so much by access to the internet but by people's ability to interact in cyberspace, which calls for specific digital communication skills. These skills are also required for participation in e-learning, bearing in mind that the deaf and hard of hearing have certain characteristics related to their condition. This study aims to identify inequalities in access to e-learning by those who are deaf or hard of hearing, observe how they are related to social and demographic factors, and confirm whether the accessibility of the e-learning environment has a direct influence on their satisfaction. The study has been conducted via an electronic survey in Spain with a non-probabilistic sample, in line with the characteristics of this sector of the population, recording social and demographic data, and information about the participants' experience of e-learning and their satisfaction with the experience. The representative survey sample consisted of 484 deaf and hard-of-hearing individuals in Spain, aged between 16 and 64. Using a chi-square test for independence we obtained a significant relationship between participation in online courses and the following variables: level of education, knowledge of sign language, and number of members in the household. A correspondence analysis was then carried out to detect particular relationships between classes of the related variables.
Keywords: e-learning, deaf, hard-of-hearing, drop-out factors, satisfaction factors, accessibility
One could probably find as many definitions of e-learning as there are authors. Sangrà, Vlachopoulos, and Cabrera (2012) conducted a study which began by reviewing literature since 2005. They found that the definitions could be grouped in four categories: 1) technology-driven, 2) delivery-system-oriented, 3) communication-oriented, and 4) educational-paradigm-oriented. They then submitted a Delphi international survey to 33 experts from 16 countries, 31 of whom rated the following proposed final definition positively: "E-learning is an approach to teaching and learning, representing all or part of the educational model applied, that is based on the use of electronic media and devices as tools for improving access to training, communication and interaction and that facilitates the adoption of new ways of understanding and developing learning" (Sangrà et al., 2012, p. 152).
The literature describes numerous and varied advantages for the student in e-learning environments (Cabero & Gisbert, 2005; López Camps, 2005; Lowerison, Côté, Abrami, & Lavoie, 2008; Martínez Caro, 2008; Area & Adell, 2009), which can be summarised as follows:
Despite these advantages e-learning has high drop-out rates. Levy (2007) comments that the literature records drop-out levels for on-line courses of 25% to 45% compared to 10% to 20% for face-to-face classes. Rostaminezhad, Mozayani, Norozi, and Izy (2013) give updated figures based on a review of the literature and have found various studies of drop-out rates recording levels from 23.9% to 54%, concluding from international reports that the average rate is 40%.
The most exhaustive study of the factors influencing drop-out rates may well be that by Park (2007), who analysed the results of 18 previous studies and proposed a model based on four factors to explain drop-out rates among adult students taking on-line courses (Figure 1). However, Lee and Choi (2011, quoted by Grau-Valldosera & Minguillón, 2014) conducted a study that revealed that previous research had focused mainly on the reason for drop-outs, there being no clear definition of what "drop-out" meant, which made it difficult to compare different studies of the subject.
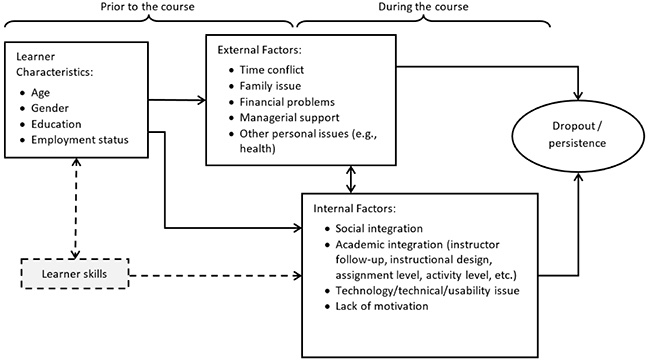
Figure 1. Theoretical model of drop-out levels among adult students following on-line courses (Park, 2007).
Sun, Tsai, Finger, Chen, and Yeh (2008) conducted a review of the literature and grouped the factors that favoured student satisfaction in six dimensions, which included 13 variables. The authors concluded that in Taiwan seven variables accounted for 66.1% of the variation in user satisfaction: students' anxiety about IT, the teacher's attitude to e-learning, the flexibility of the e-learning course, the quality of the e-learning course, perceptions of usefulness, perceptions of ease of use, and variations in assessment. The most important of these is the quality of the course, referring both to the design of the content and to the technological design of the course, the latter playing an important role in students' perception of its usefulness and ease of use.
The Organisation for Economic Co-operation and Development (OECD) defines the digital divide as "the gap between individuals, households, businesses and geographic areas at different socio-economic levels with regard both to their opportunities to access information and communication technologies (ICTs) and to their use of the Internet for a wide variety of activities" (Organisation for Economic Co-operation and Development, 2001, p. 5). The underlying causes of the digital divide have been studied extensively, the most important being economic resources, geography, age, gender, and education (UNESCO, 2005; Liangzhi Yu, 2006, as cited by Selwyn & Facer, 2007; Ally & Samaka, 2013).
In Spain, an analysis of the Survey on the Availability and Use of Information and Communication Technologies in Homes in 2013 (National Statistics Institute, 2013) reveals that the digital divide in access to the internet is practically the same as that affecting the general public's use of on-line courses, the factors most directly related to levels of participation in such courses:
Gender is an exception, as women participate more than men: 14.3% of women versus 11.4% of men.
Regarding those who are deaf or hard of hearing, a study by Fundación Vodafone España (2013) reveals a clear digital divide in this group, compared with the population as a whole, and a second digital divide within the deaf and hard of hearing group, influenced mainly by gender, age, level of education and family income. We thus find that 32% of women aged 18 to 64 who are hard of hearing use the internet less than men; a person who is hard of hearing is less likely than the rest of the population ever to have used the internet at any age, the difference being more pronounced after the age of 45, when the difference is 48.1%; there is a 30 percentage point difference in middle-level studies, compared with the rest of the population, and the use of the internet by the deaf and hard of hearing is half that of the rest in homes where monthly income is in excess of 2,000 euros.
In the light of its study of statistics for the five continents Miniwatts Marketing Group (Internet World Stats, 2016) proposes strategies to reduce the impact of the digital divide and increase people's motivation to participate in e-learning. One of the central issues raised is universal access to information and the need for people with disabilities to participate and learn from the internet, in line with the words of Berners Lee, WC3 Director and inventor of the World Wide Web: "the power of the Web is in its universality. Access by everyone regardless of disability is an essential aspect" (W3C-World Wide Web Consortium 1997, para. 1). Proposals for closing the digital divide depend on access to information and communication in cyberspace, overcoming economic, social, and geographical difficulties and ensuring accessibility and democratic access.
In the literature, one can find examples of e-learning environments adapted to the characteristics and learning styles of the deaf and hard of hearing (Straetz, Kaibel, Raithel, Spech, Grote & Kramer, 2004; Drigas, Vrettaros, & Kouremenos, 2005; Debevc, Stepanovič, & Holzinger, 2014; Fuertes, González, Mariscal, & Ruiz, 2005; Esparrell & Sánchez, 2011). Notwithstanding the positive results of these e-learning experiences for the deaf and hard of hearing, most of the training currently available is not accessible for such students (Fichten et al., 2009).
This study attempts to answer the following questions:
These questions correspond to the following hypotheses formulated in the research:
The study was carried out using an individual on-line questionnaire which respondents completed by themselves. This made it possible to compile information with significant savings in costs and materials, as it was not necessary to employ interviewers or meet the cost of travel by the researcher to conduct interviews. Other advantages of this type of questionnaire, compared to others, are that the respondent can choose the best time and place to complete it, taking as long as necessary, and that it guarantees anonymity. With this procedure, the researcher's presence and behaviour do not influence the respondent when he/she is completing the questionnaire, a crucial aspect in standardising surveys based on samples (Corbetta, 2007). Lastly, given that e-learning takes place via the internet, the on-line questionnaire itself, from the start, filters deaf and hard of hearing individuals who participate in cyberspace.
The population under study comprises individuals in Spain who are deaf or hard of hearing and aged 16 to 64. Data from the National Statistics Institute (2013) and Fundación Vodafone España (2013) indicate that there are 141,340 people who are deaf or hard of hearing and use the internet. This means that a sample of 384 individuals who are deaf or hard of hearing are necessary for the study to have a margin of error of 5% and a confidence level of 95%. According to Corbetta (2007) and Pérez (2008) probability sampling is not possible when one does not have a list of the population. There is no official census for the deaf and hard of hearing, only statistical data. We therefore opted for non-probability sampling. Of the non-probability sampling techniques the most suitable for the population in our study could be the "snowball" approach, which is useful for "small groups which are scattered around the country but in contact with each other in some way (members of religious minorities, specific groups, associations, etc.)" (Corbetta, 2007, p. 288).
As well as the usual social and demographic questions, the questionnaire includes others related to respondents' real use of e-learning and their opinions about their personal experience of e-learning. Accordingly, in line with the objectives proposed in this study, it was considered desirable to obtain information about three areas:
The final version of the questionnaire consisted of 27 questions, 25 of which were closed and two open-ended. Of the closed questions, 19 were multiple-choice, three were dichotomous, and three were filter questions. Closed questions were chosen as far as possible for two main reasons: firstly, they facilitate the standardisation of questions and the uniformity of responses and, secondly, as Corbetta (2007) points out, the respondent is not likely to have given the issues deep thought before seeing the questions.
The Likert scale is used in questions related to satisfaction and the personal evaluation of experience, as it makes it easier to determine the degree of agreement or disagreement in dimensions related to satisfaction and the advantages of e-learning. Given that one of the limitations of closed questions is that they exclude other possible answers not anticipated by the researcher, four questions have the option "Other," which invites the respondent to add any aspect not included in the questions.
The formulation of the questions takes the suggestions of Padua, Ahman, Apezechea, & Borsotti (1979), Sierra Bravo (2001), Corbetta (2007), and Pérez (2008) into account. Although it was not necessary to follow each and every recommendation they make, it seemed especially opportune, given the particular characteristics of the population under study, to take special care to ensure that the questionnaire was accessible electronically for all those who were deaf or hard of hearing. The questionnaire has therefore been translated into Spanish sign language and Catalan sign language for deaf people who use these languages.
When the questionnaire had been designed and the on-line survey tool chosen, it was pretested between May 26 and May 30, 2014, with a subsequent debriefing session, so that some improvements could be incorporated in the final version. Field work was carried out between June 6 and July 13, 2014. The questionnaire was distributed by e-mail to 144 organisations for the deaf and hard of hearing in Spain, use also being made of social networks and text messaging, to develop the "snowball" sampling referred to above. Alzina (2009) points out that one of the weaknesses of internet surveys is that there is little motivation for participants and expressly recommends the use of incentives. We therefore entered all participants in a draw for a 100-euro gift card to be used for personal purchases. In line with the suggestions of Sierra Bravo (2001), the questionnaire was disseminated in various rounds with reminders to encourage participation.
All these elements were included in a flow chart to plan the survey reproduced in Figure 2. Given the characteristics of the population being studied, it was especially important to allow for the accessibility of the questionnaire for all deaf and hard-of-hearing individuals and it was accordingly translated into Spanish and Catalan sign language by professional interpreters.
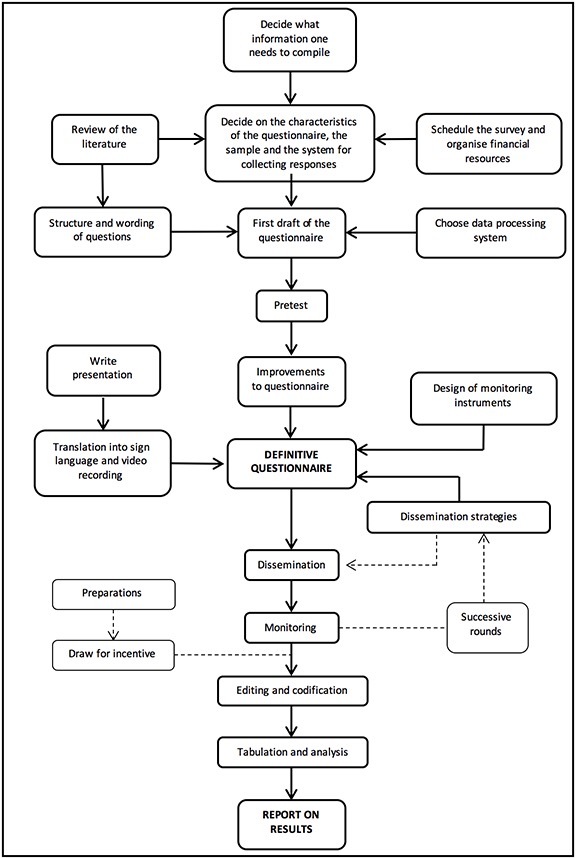
Figure 2. Stages in the development of the questionnaire. Adapted from Research Methods in Education (p.210), by L. Cohen, L. Manion, and K. Morrison, 2007, New York: Routledge. Copyright 2007 by Routledge.
The sample used in this representative survey consisted of 484 deaf and hard-of-hearing individuals in Spain (excluding Ceuta and Melilla), aged between 16 and 64. The breakdown by area of residence is shown in Figure 3. 57.2% of the sample were women and the remaining 42.8% were men. A total of 80.2% of respondents were profoundly or totally deaf and 56.6% had been deaf since birth. The sample was quite balanced in the system of communication used, as 51.1% used both oral communication and sign language in everyday life.
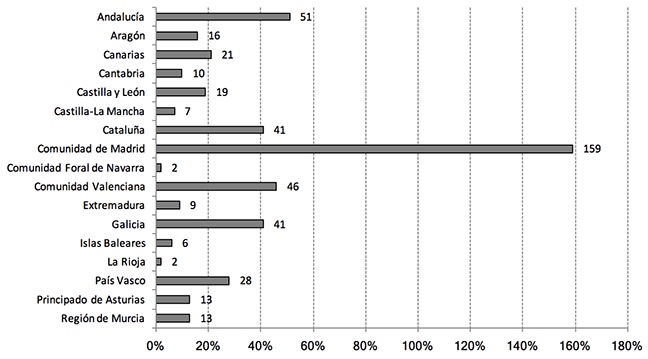
Figure 3. Breakdown of sample by Autonomous Regions (absolute numbers). The regions considered are Spain's first level administrative division, consisting of 17 "Autonomous Communities" with a certain number of transferred powers.
The level of participation in e-learning is reasonably high, as 227 respondents (46.9%) have followed an on-line course, nearly half of the sample. 23.2% of respondents have followed such a course in the last year (Figure 4).
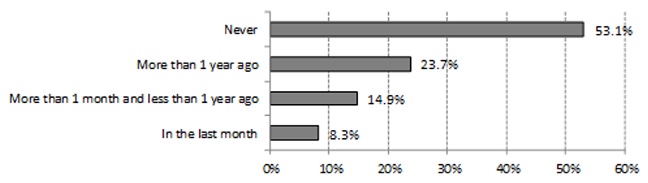
Figure 4. Respondents' last participation in an on-line course (relative data).
It is interesting to examine the social and demographic profile of those participating in e-learning activities to determine whether there are any characteristics that may be related to a greater or lesser degree of participation. In Table 1 we present the p-values of the chi-squared tests for independence between these social and demographic characteristics (X1 to X14) and participation in e-learning (X15). We find significant relationships between participation in on-line courses and the following variables: knowledge of sign language (X5), level of education (X11), and number of members in the household (x14). The most notable of these are level of education and knowledge of sign language.
Table 1
P-Values of the Chi-Squared Tests for Independence
| X1: sex (n=484) | 0.325 |
| X2: age (n=484) | 0.622 |
| X3: degree of deafness (n=484) | 0.157 |
| X4: age at which deafness occurred (n=484) | 0.274 |
| X5: knowledge of sign language (n=484) | 0.000* |
| X6: language which respondents understand best and in which they express themselves best (n=421) | 0.186 |
| X7: language used normally (n=421) | 0.141 |
| X8: size of habitat (n=484) | 0.183 |
| X10: nationality (n=484) | 0.900 |
| X11: level of education (n=484) | 0.000* |
| X12: employment situation (n=484) | 0.121 |
| X13: net monthly household income (n=484) | 0.063 |
| X14: number of members of household (n=484) | 0.005* |
* The relationship is significant at 0.01
Note. All of the variables are considered nominal. X1: man=0, woman=1; X2: 18 to 29=0, 30 to 39=1, 40 to 49=2, 49 to 60=3; X3: mild=0m, moderate=1, profound=2, total=3; x4: not sure=0, after age 15 =1, from 11 to 15 years old=2, from 6 to 10 years old=3, before 6 years old=4, at birth=5; X5: No=0, Yes=1; X6: sign language=0, oral language=1, both; X7: sign language=0, oral language=1, both; X8: data not available=0, less than 10.000 inhabitants=1, 10.000 to less than 20.000=2, 20.000 to less than 50.000=3, 50.000 to less than 100.000=4, 100.000 and over=5; X10: foreign=0, Spanish=1, Spanish and other=2; X11: illiterate=0, primary=1, lower secondary=2, upper secondary=3, vocational education=4, certificate of higher education=5, University=6, Doctorate=7; X12: other situation=0, housework=1, disabled or pensioner=2, unemployed=3, student=4, employee=5, freelance=6; X13: don't know/no reply=0, less than 1.100 €=1, from 1.101 to 1.800 €=2, from 1.801 to 2.700 €=3, over 2.700 €=4; X14: numeric value; X15: never=0, more than 1 year ago=1, more than one month and less than 1 year ago=2, less than 1 month ago=3.
The Kendall and Spearman correlation coefficients are calculated for X5 to X15 (Table 2) and a negative correlation can be observed: participation in on-line courses is lower among deaf and hard-of-hearing individuals who know sign language. There is a positive correlation between level of education (X11) and participation in on-line courses (X15) (Table 3).
Table 2
Kendall and Spearman Correlation Coefficients Between X5 (Knowledge of Sign Language) and X15 (Participation in Online Courses)
| X5 | X15 | |||
| Kendall's tau_b | X5 | Correlation coefficient | 1.000 | -.110 ** |
| Sig, (bilateral) | , | .010 | ||
| N | 484 | 484 | ||
| X15 | Correlation coefficient | -.110 ** | 1.000 | |
| Sig, (bilateral) | .010 | , | ||
| N | 484 | 484 | ||
| Spearman's rho | X5 | Correlation coefficient | 1.000 | -.118 ** |
| Sig, (bilateral) | , | .010 | ||
| N | 484 | 484 | ||
| X15 | Correlation coefficient | -.118 ** | 1.000 | |
| Sig, (bilateral) | .010 | , | ||
| N | 484 | 484 | ||
**. Correlation is significant at 0.01 (2 tails).
Note. All of the variables are considered nominal with the same values described in Table 1.
Table 3
Kendall's and Spearman's Correlation Coefficients for X11 (Level of Education) and X15 (Participation in Online Courses)
| X15 | X11 | |||
| Kendall's tau_b | X15 | Correlation coefficient | 1.000 | .274 ** |
| Sig, (bilateral) | , | .000 | ||
| N | 484 | 484 | ||
| X11 | Correlation coefficient | .274 ** | 1.000 | |
| Sig, (bilateral) | .000 | , | ||
| N | 484 | 484 | ||
| Spearman's rho | X15 | Correlation coefficient | 1.000 | .329 ** |
| Sig, (bilateral) | , | .000 | ||
| N | 484 | 484 | ||
| X11 | Correlation coefficient | .329 ** | 1.000 | |
| Sig, (bilateral) | .000 | , | ||
| N | 484 | 484 | ||
**. Correlation is significant at 0.01 (2 tails).
Note. All of the variables are considered nominal with the same values described in Table 1.
Although one individual could have participated in various types of on-line course, only 24.7% of respondents followed an officially regulated course, while 57.3% followed complementary or ongoing education courses (Figure 5).
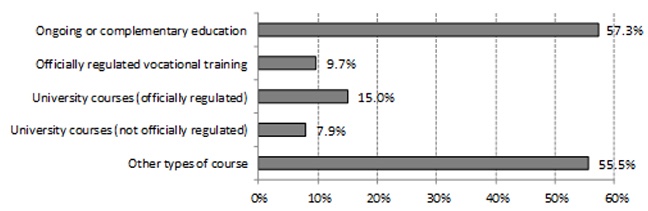
Figure 5. Type of courses in which deaf and hard of hearing individuals have participated at some time (relative data). Multiple answers possible. Valid answers: 227.
Finally, we need to consider why 53.1% of the deaf and hard of hearing have never participated in e-learning activities (Figure 4). Among the main reasons reported, the inaccessibility of e-learning perceived by the deaf and hard of hearing is the second most important reason for 28% of the sample (Figure 6).
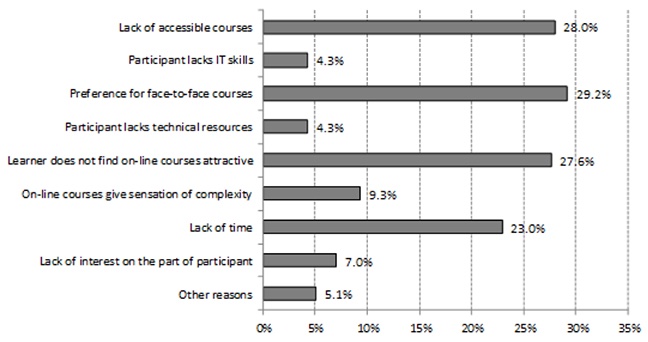
Figure 6. Reasons alleged by deaf and hard of hearing individuals not to engage in e-learning activities (relative data). Multiple answers possible. Valid answers: 257.
In the questionnaire, respondents were asked to assess a series of features according to their degree of importance: the quality and attitude of instructors (Figure 7), course programme and quality of content (Figure 8), technological quality of the platform (Figure 9), working with fellow students (Figure 10), and accessibility of the on-line course (Figure 11). All these aspects were rated as quite important to extremely important, although clear differences can be observed in two of them: cooperation with peers in on-line courses is the aspect deaf and hard of hearing users consider least important (Figure 10), while the accessibility of e-learning is rated as extremely important (Figure 11).
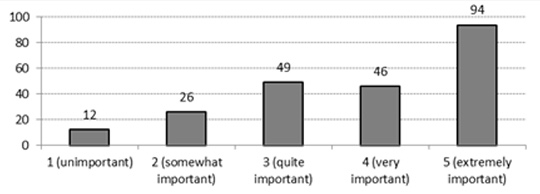
Figure 7. Importance given by deaf and hard of hearing e-learning students to the quality and attitude of instructors (absolute numbers). Valid answers: 227.
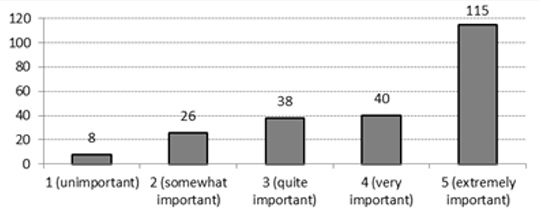
Figure 8. Importance given by deaf and hard of hearing e-learning students to the course programme and quality of content (absolute numbers). Valid answers: 227.
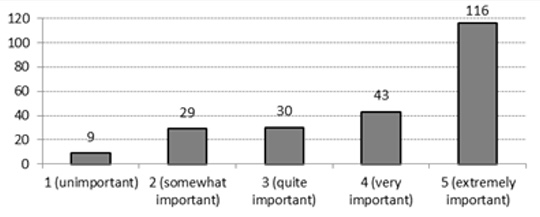
Figure 9. Importance given by deaf and hard of hearing e-learning students to the technological quality of the platform (absolute numbers). Valid answers: 227.
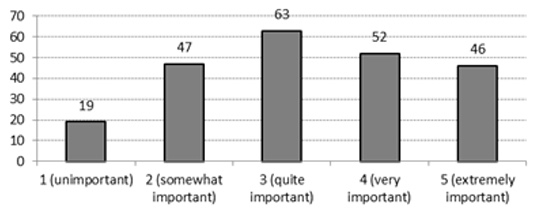
Figure 10. Importance given by deaf and hard of hearing e-learning students to cooperation with fellow learners (absolute numbers). Valid answers: 227.
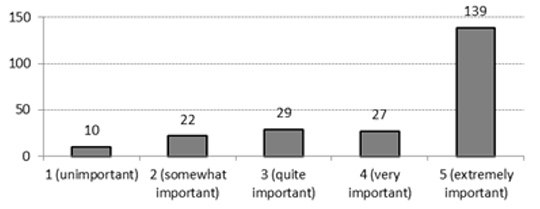
Figure 11. Importance given by deaf and hard of hearing e-learning students to accessibility of the course (absolute numbers). Valid answers: 227.
The two advantages of e-learning emphasised most by the deaf and hard of hearing are access anywhere at any time (68.3%; Figure 11) and reduced costs and less travel (67%; Figure 12). The accessibility of e-learning is seen as an advantage in comparison with face-to-face learning by 60.8% (Figure 13).
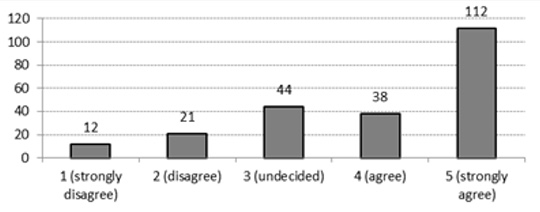
Figure 12. Degree of agreement with the following statement: "access anywhere at any time is an advantage of e-learning" (absolute numbers). Valid answers: 227.
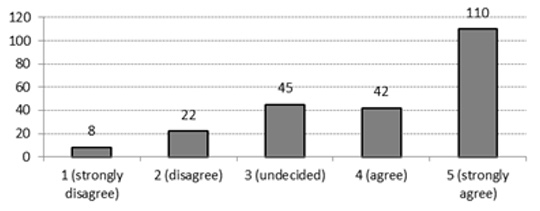
Figure 13. Degree of agreement with the following statement: "reduced costs and less travel are advantages of e-learning" (absolute numbers). Valid answers: 227.
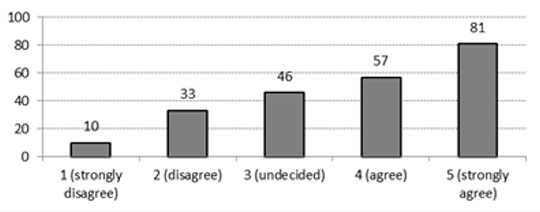
Figure 14. Degree of agreement with the following statement: "the possibility of accessing courses without barriers is an advantage of e-learning not found in face-to-face tuition" (absolute numbers). Valid answers: 227.
Another aspect studied was the number of drop-outs from e-learning courses, a figure of 37.4% being recorded for the sample (Figure 15). The reasons for giving up are many and varied but the most frequently cited is the lack of accessibility in on-line courses (38.8%), followed closely by loss of interest as the course proceeds, mentioned by 36.5% (Figure 16).
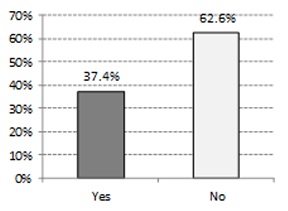
Figure 15. Percentage of deaf and hard of hearing participants who have dropped out of an on-line course at some time (relative data). Valid answers: 227.
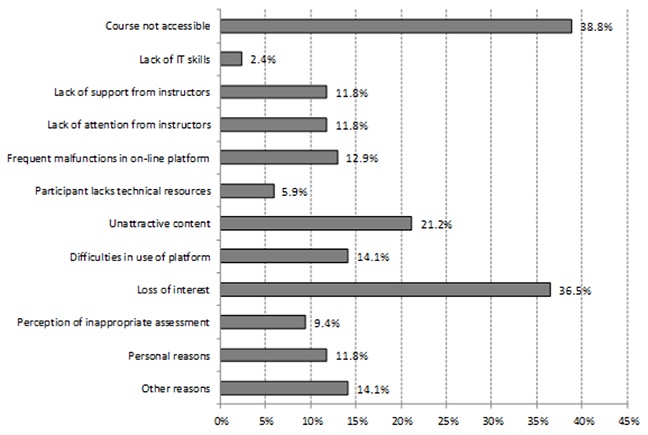
Figure 16. Reasons alleged by deaf and hard of hearing participants to drop out of an on-line course at some time by reason for giving up (relative data). Multiple answers possible. Valid answers: 85.
Levels of drop-out and satisfaction with the e-learning experience were analysed to determine whether there were relationships with the following social and demographic characteristics: sex, age, degree of deafness, age of onset of deafness, language of communication, size of habitat, level of education, employment situation, and net monthly household income (Table 4). Significant relationships were found between:
Level of education (X11) and levels of drop-out (X20).
Level of education (X11) and overall satisfaction with the experience (X22).
Net monthly household income (X13) and overall satisfaction with the experience (X22)
Table 4
P-Values of the Chi-Squared Tests for Independence
| X20: participant has dropped out at some time | X22: general assessment of experience | |
| X1: sex (n=227) | 0.197 | 0.764 |
| X2: age (n=227) | 0.580 | 0.445 |
| X3: degree of deafness (n=227) | 0.286 | 0.739 |
| X4: age at which deafness occurred (n=227) | 0.540 | 0.932 |
| X5: knowledge of sign language (n=227) | 0.845 | 0.694 |
| X6: language which respondents understand best and in which they express themselves best (n=191) | 0.845 | 0.958 |
| X7: language used normally (n=191) | 0.918 | 0.905 |
| X8: size of habitat (n=227) | 0.305 | 0.459 |
| X11: level of education (n=227) | 0.038* | 0.013* |
| X12: employment situation (n=227) | 0.951 | 0.674 |
| X13: net monthly household income (n=227) | 0.083 | 0.018* |
* Relation is significant at 0.05
Note. Variables X1 to X13 are considered nominal and have the same values described in Table 1. X20 (nominal): no=0, yes=1; X22 (ordinal): Likert scale from 1 (very negative) to 5 (very positive).
When Kendall's and Spearman's correlation coefficients are calculated, a positive correlation can be observed between level of education (X11) and general assessment of the experience (X22): the higher the level of education, the better the individual's assessment of their experience of on-line courses (Table 5).
Table 5
Kendall's and Spearman's Correlation Coefficients for X11 (Level of Education) and X22 (General Assessment of the Experience)
| X11 | X22 | |||
| Kendall's tau_b | X11 | Correlation coefficient | 1.000 | .158** |
| Sig, (bilateral) | , | .004 | ||
| N | 484 | 227 | ||
| X22 | Correlation coefficient | .158** | 1.000 | |
| Sig, (bilateral) | .004 | , | ||
| N | 227 | 227 | ||
| Spearman's rho | X11 | Correlation coefficient | 1.000 | .192** |
| Sig, (bilateral) | , | .004 | ||
| N | 484 | 227 | ||
| X22 | Correlation coefficient | .192** | 1.000 | |
| Sig, (bilateral) | .004 | , | ||
| N | 227 | 227 | ||
Note. X11 (ordinal): illiterate=0, primary=1, lower secondary=2, upper secondary=3, vocational education=4, certificate of higher education=5, University=6, Doctorate=7; X22 (ordinal): Likert scale from 1 (very negative) to 5 (very positive).
** Correlation is significant at 0.01 (2 tails).
A total of 67.6% deaf and hard of hearing respondents think e-learning videos should be subtitled. The second and third most frequently mentioned requirements, at 47.4% and 45% respectively, are for courses to be taught in sign language and for texts to be translated into sign language (Figure 17).
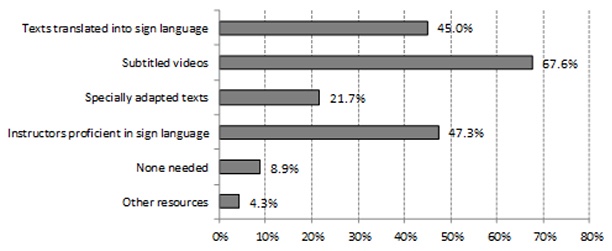
Figure 17. List of accessibility requirements specified by the deaf and hard of hearing for online courses (relative data). Multiple answers possible. Base: 484.
It is interesting to consider here the difference between the accessibility needs of those who have at some time participated in an on-line course and those who have not, the difference between those who have dropped out at some time and those who have not, and the difference between those who report being most satisfied and least satisfied. P-values of chi-squared tests for independence were established between these variables and the accessibility resources requested (Table 6), the results showing that:
Table 6
P-Values of The Chi-Squared Tests for Independence Between Accessibility Requirements and e-Learning Participation, Dropping Out and Satisfaction
| X25a | X25b | X25c | X25d | X25e | X25f | |
| X15a (n=484) | 0.053 | 0.000** | 0.783 | 0.798 | 0.957 | 0.021* |
| X20 (n=227) | 0.396 | 0.402 | 0.318 | 0.118 | 0.471 | 0.046* |
| X22 (n=227) | 0.230 | 0.590 | 0.259 | 0.335 | 0.398 | 0.729 |
* Relationship is significant at 0.05
** Relationship is significant at 0.01
Note. X15a=individuals who have participated in e-learning at some time. X20=individuals who have dropped out of an on-line course at some time. X22=assessment of the experience. X25a=need for texts translated into sign language. X25b=need for subtitled videos. X25c=need for specially adapted texts. X25d=need for teachers with knowledge of sign language. X25e=no accessibility resources needed in e-learning. X25f=need for resources other than those above.
X15a (nominal): no=0, yes=1; X20 (nominal): no=0, yes=1; X22 (ordinal): Likert scale from 1 (very negative) to 5 (very positive); X25a (nominal): no=0, yes=1; X25b (nominal): no=0, yes=1; X25c (nominal): no=0, yes=1; X25d (nominal): no=0, yes=1; X25e (nominal): no=0, yes=1; X25f (nominal): no=0, yes=1.
The chi-square p value shows a close relationship between level of education and participation in on-line courses (p=0.000 significant at 0.01). Calculating Kendall's and Spearman's correlation coefficients (Table 3) it can be seen that when the level of studies is lower, there is less participation in on-line courses. This factor, related to the digital divide, coincides in the deaf and hard-of-hearing and the general population, as does the number of members of the household, but there is a third socio-demographic factor that is not related to the digital divide in e-learning in the general population but is relevant in the case of the deaf and hard-of-hearing: knowledge of sign language has a 0.000 negative correlation with participation in on-line courses (significant at 0.01), individuals knowing sign language participating less in such courses.
Knowledge of sign language is not a factor that appears in studies of the population as a whole, as we have already pointed out, but among those who are deaf or hard of hearing there is a negative correlation, so that those who know sign language are less likely to participate in e-learning activities. This could be due to the fact that instructors proficient in sign language and texts translated into sign language are two of the resources most often requested by the deaf and hard of hearing (47.3% and 45.0% respectively; Figure 17), while the availability of accessible e-learning in Spain is very limited, despite the efforts made in certain specific cases in recent years (Fuertes et al., 2005; Fuentes & Hernández, 2011).
Turning to social and demographic factors, we find no significant relationship between gender and the degree of satisfaction with the e-learning experience (ρ=0.764) so we may conclude that the satisfaction of deaf and hard of hearing participants is independent of gender. However, there is a significant relationship at 0.05 with the participant's level of education (ρ=0.013), showing that the higher the level of education reached by deaf and hard of hearing participants, the greater their satisfaction with the e-learning experience. A significant relationship can also be seen between monthly household income and satisfaction with the e-learning experience [Kendall's and Spearman's correlations pending]
The opinions of those who are deaf and hard of hearing generally coincide with the dimensions affecting the satisfaction of participants in e-learning identified by Sun et al. (2008), although here we have not compiled information on all the variables contained in these dimensions. One exception is that only 43.1% of the deaf and hard of hearing consider cooperation with peers important in on-line learning. In the study carried out by Sun et al. this dimension corresponds to the variable of perception of the student's interaction with others (environment dimension). On the other hand, 73.1% of deaf and hard of hearing learners consider the accessibility of the course important, which does not correspond to any of the variables identified by Sun et al.
Their preference for face-to-face courses is the most important reason why 29.2% of the deaf and hard of hearing have never participated in e-learning activities. In fact, among deaf and hard of hearing individuals who have participated in e-learning at some time, 73.1% consider accessibility to be the most important factor but do not identify it as one of the main advantages of e-learning over face-to-face tuition. We thus find that those who do not participate allege that problems of accessibility are the main obstacle and those who do participate assign great importance to accessibility, although it is not precisely seen as an advantageous characteristic of e-learning. Finally, lack of accessibility is also the main reason why 38.8% of the deaf and hard of hearing who have participated in e-learning at some time dropped out. It is therefore clear that accessibility has a significant influence on the deaf and hard of hearing, regarding both their participation in e-learning, their satisfaction, and the likelihood that they will drop out, confirming the results of Fichten et al. (2009) and the ICT Accessibility Observatory (2013).
Deaf and hard of hearing individuals who have participated in e-learning activities at some time confirm all the advantages reported in the literature for the population as a whole, flexibility regarding time and location (68.3%) and reduced cost and less travel (67%) being the advantages most often reported by the deaf and hard of hearing (Figures 11 and 12).
Regarding drop-outs, Levy (2007) says that in the literature a 25% to 45% drop-out rate is recorded for e-learning courses among the population as a whole. Among deaf and hard of hearing students the drop-out rate is 37.4%. Although this is high, it is near the 40% average that emerges from the international reports examined in the review of the literature carried out by Rostaminezhad et al. (2013).
Rostaminezhad et al. (2013) cite motivation as the factor most often given as the reason for dropping out of e-learning courses. Among deaf and hard of hearing students, the most important cause for 38.8% of the sample was problems of accessibility in the course, a factor which is not expressly mentioned in Park's (2007) theoretical model for the population as a whole. However, the second factor coincides with the observations of Rostaminezhad et al., as loss of interest during the course accounted for 36.5% of cases, considerably more than those related to the third cause, unattractive course content (related to Park's academic integration factor).
Finally, the accessibility of the on-line course was the aspect deaf and hard of hearing learners considered most important (73.1% rated it as very important or extremely important), which suggests that the more accessible a course is, the more participants there will be. The accessibility resource requested by most respondents is the subtitling of videos (67.6%). It is followed by the availability of instructors proficient in sign language (47.3%), the translation of texts into sign language (45%), and the availability of texts at different levels of reading difficulty (21.7%). There is also a significant negative correlation at 0.05 bilateral between those who are less satisfied and the need for texts translated into sign language (ρ=-0.137), suggesting that one of the reasons for the dissatisfaction of deaf and hard of hearing learners is the absence of this resource in the e-learning environment.
Three limitations to this study need to be pointed out. Firstly, although snowball sampling is the most suitable approach for the target group, it has certain limitations and other studies will need to be carried out in future to confirm the results. Secondly, this study does not take account of the characteristics of the e-learning courses in which the respondents participated, such as prior motivation, the educational context in which they take place, their technical characteristics, etc. and it would be interesting to examine these aspects in greater depth in future. Finally, in this study no distinction is made between different geographical regions or urban and rural areas and there is scope for further work on the findings.
In future research, studies could be carried out to examine qualitatively in greater depth the motivation of deaf and hard-of-hearing people to take part in e-learning courses, the specific accessibility problems they have to face and how they deal with them. Secondly, studies could be carried out to look more deeply into possible differences in the study strategies used by the deaf and hard-of-hearing as e-learning students according to the language of communication used (sign language or oral communication).
The purpose of this study was to examine the existence of inequalities in access to e-learning by individuals in Spain who are deaf or hard of hearing and aged 16 to 64, compared with the population as a whole and to confirm the following hypotheses:
Ally, M., & Samaka, M. (2013). Open educational resources and mobile technology to narrow the learning divide. The International Review of Research in Open and Distance Learning, 14 (2), 14-27.
Alzina, R.B. (Ed.). (2009). Metodología de la investigación educativa [Methodology of Educational Research]. Madrid: La Muralla.
Area, M., & Adell, J. (2009). eLearning: Enseñar y aprender en espacios virtuales [eLearning: Teaching and Learning in Vistual spaces]. In J. De Pablos (Ed.), Tecnología educativa. La formación del profesorado en la era de Internet. Málaga: Aljibe.
Cabero, J., & Gisbert, M. (2005). Formación en Internet. Guía para el diseño de materiales didácticos. [Education on the Internet. Guide for the design of teaching materials]. Sevilla: MAD.
Cohen, L., Manion, L., & Morrison, K. (2007). Research methods in education. New York: Routledge.
Corbetta, P. (2007). Metodología y técnicas de investigación social. Edición revisada. [Methodology and techniques in social research. Reviewed edition.] Madrid: McGraw-Hill/Interamericana de España.
Debevc, M., Stepanovič, Z., & Holzinger, A. (2014). Development and evaluation of an e-learning course for deaf and hard of hearing based on the advanced Adapted Pedagogical Index method. Interactive Learning Environments, 22(1), 35-50. doi: http://dx.doi.org/10.1080/10494820.2011.641673
Drigas, A.S., Vrettaros, J., & Kouremenos, D. (2005). An e-learning management system for the deaf people. WSEAS Transactions on Advances in Engineering Education, 2(1), 20-24.
Esparrell, J. A. F., & Sánchez, A. M. H. (2011). Campus virtual Mundosigno: Un espacio de aprendizaje accesible creado desde una perspectiva integradora. [Mundosigno Virtual Campus: A learning space created from an integrating perspective]. Revista Científica Electrónica de Educación y Comunicación en la Sociedad del Conocimiento, 11.
Fichten, C.S., Ferraro, V., Asuncion, J.V., Chwojka, M., Barile, M., Nguyen, M.N.,... Wolforth, J. (2009). Disabilities and e-learning problems and solutions: An exploratory study. Journal of Educational Technology & Society, 12(4), 241-256.
Fuertes, J.L., González, A.L., Mariscal, G., & Ruiz, C. (2005). Herramientas de apoyo a la educación de personas sordas en la Universidad Española. [Education supporting tools for the education of deaf people at the Spanish University]. Enseñanza, 430, 45-52.
Fundación Vodafone España. (2013). Acceso y uso de las TIC por las personas con discapacidad. Informe ejecutivo. [Access and use of ICT for people with disabilities. Executive report]. Fundación Vodafone España.
Grau-Valldosera, J., & Minguillón, J. (2014). Rethinking dropout in online higher education: The case of the Universitat Oberta de Catalunya. The International Review of Research in Open and Distance Learning, 15(1), 290-308.
ICT Accessibility Observatory. (2013). Tecnología educativa 2.0: accesibilidad de plataformas e-learning, recursos educativos y libro electrónicos. Febrero 2013. Versión detallada. [Education technology 2.0: accessibility on e-learning platforms, educational resources and electronic books. February, 2013. Detailed version.] Discapnet, Fundación ONCE y Technosite. Retrieved from http://www.discapnet.es/Castellano/areastematicas/Accesibilidad/Observatorio_infoaccesibilidad/informesInfoaccesibilidad/Documents/Informe%20detallado%20Observatorio%20Tecnolog%C3%ADa%20Educativa%202.0%2001-04-2013.pdf
Internet World Stats. (2016). The digital divide, ICT, and broadband internet. Miniwatts Marketing Group. Retrieved from http://www.internetworldstats.com/links10.htm
Levy, Y. (2007). Comparing dropouts and persistence in e-learning courses. Computers & Education, 48(2), 185-204.
López Camps, J. (2005). Planificar la formación con calidad. [Quality education planning.] Barcelona: Praxis.
Lowerison, G., Côté, R., Abrami, P.C., & Lavoie, M.C. (2008). Revisiting learning theory for e-learning. In S. Carliner, S., & P. Shank (Eds.), The e-learning handbook. Past promises, present challenges (pp. 423-458). San Francisco: Pfeiffer.
Martínez Caro, E. (2008). E-learning: Un análisis desde el punto de vista del alumno. [E-learning: an analysis from the student's point of view.] RIED: revista iberoamericana de educación a distancia, 11(2), 151-168.
National Statistics Institue. (2008). Encuesta sobre Discapacidades, Autonomía personal y situaciones de Dependencia 2008 [Survey on Disabilities, Personal Autonomy and Dependency Situations]. Retrieved from http://www.ine.es/jaxi/menu.do?L=0&type=pcaxis&path=/t15/p418&file=inebase
National Statistics Institute. (2013). Encuesta sobre Equipamiento y Uso de Tecnologías de la Información y Comunicación en los hogares 2013 [Survey on the Availability and Use of Information and Communication Technologies in Homes]. Retrieved from http://www.ine.es/dynt3/inebase/index.htm?type=pcaxis&path=/t25/p450/a2013/&file=pcaxis
Organisation for Economic Co-operation and Development. (2001). Understanding the digital divide. París: Organisation for Economic Co-operation and Development. Retrieved from http://www.oecd.org/sti/1888451.pdf
Padua, J., Ahman, I., Apezechea, H., & Borsotti, C. (1979). Técnicas de investigación aplicadas a las ciencias sociales. [Research techniques applied to social sciences.] México: Fondo de Cultura Económica.
Park, J.H. (2007). Factors related to learner dropout in online learning. International Research Conference in the Americas of the Academy of Human Resource Development, 1. Retrieved from http://files.eric.ed.gov/fulltext/ED504556.pdf
Pérez, A.G. (2008). Estadística aplicada: Conceptos básicos. Segunda edición. [Applied statistics: Basic concepts. Second edition.] Madrid: Editorial UNED
Rostaminezhad, M.A., Mozayani, N., Norozi, D., & Iziy, M. (2013). Factors related to e-learner dropout: Case of study of IUST Elearning Center. Procedia. Social and Behavioral Sciences, 83, 522-527.
Sangrà, A., Vlachopoulos, D., & Cabrera, N. (2012). Building an inclusive definition of e-learning: an approach to the conceptual framework. The International Review of Research in Open and Distance Learning, 13(2), 145-159. Retrieved from http://www.irrodl.org/index.php/irrodl/article/view/1161/2146
Selwyn, N., & Facer, K. (2007). Beyond the digital divide. Rethinking digital inclusion for the 21st century. In Futurelab. Retrieved from http://www.nfer.ac.uk/publications/FUTL55/FUTL55.pdf
Sierra Bravo, R. (2001). Técnicas de investigación social. Teoría y ejercicios. [Techniques in social research: Theory and exercises.] Madrid: Paraninfo.
Straetz, K., Kaibel, A., Raithel, V., Spech, M., Grote, K., & Kramer, F. (2004). An e-learning environment for deaf adults. In Proceedings from the 8th ERCIM Workshop on User Interfaces for All, Vienna, Austria, 28-29 June. Retrieved from http://ui4all.ics.forth.gr/workshop2004/files/ui4all_proceedings/adjunct/interactive_applications/77.pdf
Sun, P.C., Tsai, R.J., Finger, G., Chen, Y.Y., & Yeh, D. (2008). What drives a successful e-Learning? An empirical investigation of the critical factors influencing learner satisfaction. Computers & Education, 50(4), 1.183-1.202.
UNESCO. (2005). Towards knowledge societies. Paris: UNESCO. Retrieved from http://unesdoc.unesco.org/images/0014/001418/141843e.pdf
W3C-World Wide Web Consortium. (1997). World wide web consortium launches international program office for web accessibility initiative [Blog post]. Retrived from https://www.w3.org/Press/IPO-announce
![]()

Factors Affecting the Participation of the Deaf and Hard of Hearing in e-Learning and Their Satisfaction: A Quantitative Study by Emilio Ferreiro-Lago and Sara Osuna-Acedo is licensed under a Creative Commons Attribution 4.0 International License.