
Volume 18, Number 2
Sanghoon Park
University of South Florida
This paper reports the findings of a comparative analysis of online learner behavioral interactions, time-on-task, attendance, and performance at different points throughout a semester (beginning, during, and end) based on two online courses: one course offering authentic discussion-based learning activities and the other course offering authentic design/development-based learning activities. Web log data were collected to determine the number of learner behavioral interactions with the Moodle learning management system (LMS), the number of behavioral interactions with peers, the time-on-task for weekly tasks, and the recorded attendance. Student performance on weekly tasks was also collected from the course data. Behavioral interactions with the Moodle LMS included resource viewing activities and uploading/downloading file activities. Behavioral interactions with peers included discussion postings, discussion responses, and discussion viewing activities. A series of Mann-Whitney tests were conducted to compare the two types of behavioral interactions between the two courses. Additionally, each student's behavioral interactions were visually presented to show the pattern of their interactions. The results indicated that, at the beginning of the semester, students who were involved in authentic design/development-based learning activities showed a significantly higher number of behavioral interactions with the Moodle LMS than did students involved in authentic discussion-based learning activities. However, in the middle of the semester, students engaged in authentic discussion-based learning activities showed a significantly higher number of behavioral interactions with peers than did students involved in authentic design/development-based learning activities. Additionally, students who were given authentic design/development-based learning activities received higher performance scores both during the semester and at the end of the semester and they showed overall higher performance scores than students who were given authentic discussion-based learning activities. No differences were found between the two groups with respect to time-on-task or attendance.
Keywords: authentic learning task, behavioral experience, online learning, Web log data, time-on-task
The number of online courses has been growing rapidly across the nation in both K-12 and higher education. According to the U.S. Department of Education’s National Center for Education Statistics (NCES), approximately half of all K-12 school districts nationwide (55%) had students enrolled in at least one online course (National Center for Education Statistics [NCES], 2011). In higher education, more than 7.1 million students are taking at least one online course (Allen & Seaman, 2014). These numbers are projected to grow exponentially as more universities are striving to meet the increasing demand for online courses. Online courses are expected to provide formal learning opportunities at the higher education level using various learning management platforms (Moller, Foshay, & Huett, 2008; Shea & Bidjerano, 2014; Wallace, 2010). Consequently, E-learning systems, or learning management systems (LMSs), are being advanced to provide students with high quality learning experiences and high quality educational services in their online courses (Mahajan, Sodhi, & Mahajan, 2016).
Although the quality of an online learning experience can be defined and interpreted differently by the various stakeholders involved, previous studies identified both time flexibility and authentic learning tasks as two key factors affecting successful online learning. Time flexibility has been regarded as the most appealing option for online learning (Romero & Barberà, 2011) as it allows online learners to determine the duration, pace, and synchronicity of the learning activities (Arneberg et al., 2007; Collis, Vingerhoets, & Moonen, 1997; Van den Brande, 1994). Recently, Romero and Barberà (2011) divided time flexibility into two constructs, instructional time and learner time, and asserted the need for studies that consider the time attributes of learners, such as time-on-task quality. Authentic tasks form the other aspect of successful online learning. Based on the constructivist learning model, online students learn more effectively when they are engaged in learning tasks that are relevant and/or authentic to them (Herrington, Oliver, & Reeves, 2006). Such tasks help learners develop authentic learning experiences through activities that emulate real-life problems and take place in an authentic learning environment (Roblyer & Edwards, 2000). Authentic learning activities can take many different forms and have been shown to provide many benefits for online learners (Lebow & Wager, 1994). For example, authentic tasks offer the opportunity to examine the task from different perspectives using a variety of available online resources. Additionally, authentic tasks can be integrated across different subject areas to encourage diverse roles and engage expertise from various interdisciplinary perspectives (Herrington et al., 2006). To maximize the benefits of authentic tasks, Herrington, Oliver, and Reeves (2006) suggested a design model that involves three elements of authentic learning: tasks, learners, and technologies. After exploring the respective roles of the learner, the task and the technology, they concluded that synergy among these elements is a strong contributor to the success of online learning. Therefore, online learning must be designed to incorporate authentic learning tasks that are facilitated by, and can be completed using, multiple types of technologies (Parker, Maor, & Herrington, 2013).
In summary, both time flexibility and authentic learning tasks are important aspects of a successful online learning experience. However, few studies have investigated how online students show different behavioral interactions during time-on-tasks with different authentic learning tasks, although higher levels of online activity were found to be always associated with better final grades greater student satisfaction (Cho & Kim, 2013). Therefore, the purpose of this study was to compare behavioral interactions, time-on-task, attendance, and performance between two online courses employing different types of authentic tasks.
Web log data analysis or Web usage analysis is one of the most commonly used methods to analyze online behaviors using electronic records of a system-user interactions (Taksa, Spink, & Jansen, 2009). Web logs are the collection of digital traces that provide valuable information about each individual learner’s actions in an online course (Mahajan et al., 2016). Many recent LMSs, such as CANVAS, or the newly upgraded LMSs, such as Blackboard or Moodle, offer various sets of Web log data in the form of learning analytics. The data usually contain course log history, number of views for each page, number of comments, punctuality of assignment submission, and other technology usage. Web log files also contain a list of user actions that occurred during a certain period of time (Grace, Maheswari, & Nagamalai, 2011). This vast amount of data allows instructors and researchers to find valuable information about learners’ online course behaviors, such as how many times per day and how often students log in, how many times and how often they post to discussion boards, how many students submit assignments on time, how much time they spend on each learning task, etc. Web log data also provides personal information about online learners, such as each student’s profile and achievement scores, and each student’s behavioral interaction data, such as content viewing, discussion posting, assignment submission, writing, test taking, task performances, and communications with peers/instructor (Mostow et al., 2005). The data can be presented in the form of visualization to support students and instructors in the understanding of their learning/teaching experiences. Therefore, the Web log analysis method offers a promising approach to better understand the behavioral interactions of online learners at different points during the semester. Researchers can use Web log data to describe or make inferences about learning events without intruding the learning event or involving direct elicitation of data from online learners (Jansen, Taksa, & Spink, 2009). Although Web log data is a source of valuable information to understand online behaviors, it also has to be noted that researchers must be careful when interpreting the data with a fair amount of caution because Web log data could be misleading. For example, an online student might appear to be online for a longer time than she/he actually participated in a learning activity. Therefore, prior to conducting the Web log analysis, a researcher needs to understand the type of behavioral data to be analyzed based on the research questions and articulates the situational and contextual factors of the log data. Using the timestamps showing when the Web log was recorded, the researcher can make the observation of behaviors at certain point of time and decide the validity of the online behavior (Jansen et al., 2009).
Previous studies have shown the benefits of analyzing Web log data to understand the online learning behaviors of students. Hellwege, Gleadow, and McNaught (1996) conducted a study of the behavioral patterns of online learners while studying a geology Web site and reported that learners show a pattern of accessing the most recent lecture notes prior to accessing the Web site materials. Sheard, Albrecht, and Butbul (2005) analyzed Web log files and found that knowing when students access various resources helps instructors understand the students’ preferred learning patterns. While analyzing log data to investigate learning effectiveness, Peled and Rashty (1999) found that the most popular online activities were, in general, passive activities, such as retrieving information, rather than contributing activities. Dringus and Ellis (2005) reported on how to analyze asynchronous discussion form usage data to evaluate the progress of a threaded discussion. Several recent studies showed a positive link between students' online activities and their final course grades. For example, Valsamidis and Democritus (2011) examined the relationship between student activity level and student grades in an e-learning environment and found that the quality of learning content is closely related to student grades. Also, Dawson, McWilliam, and Tan (2008) found that when students spend more time in online activities and course discussions, they earned higher final grades. Similarly, Macfadyen and Dawson (2010) reported that the numbers of messages postings, email correspondences, and completed assessments were positively correlated with students' final course grades. Most recently, Wei, Peng, and Chou's study (2015) showed the positive correlations between the number of discussion postings, reading material viewings, and logins with students' final exam scores. Although the previous studies utilized Web log data to investigate the relationships between students' behavioral interactions and learning achievement, few studies examined how online students' behavioral interactions are different at different phases of online learning when involved in two types of authentic learning tasks.
The overall online learning experience consists of continuous behavioral interactions that are generated while completing a series of learning tasks (Park, 2015). Therefore, an examination of the nature of the learning tasks and the influences of the learning tasks on student behaviors is needed. The examined short-term learning experiences can then be combined to create a big picture of the online learning experience within a course. According to Veletsianos and Doering (2010), the experience of online learners must be studied throughout the semester due to the long-term nature of online learning programs. To analyze the pattern of behavioral interactions, this study employed time and tasks as two analysis frames because both time and tasks form essential dimensions of a behavioral experience, as shown in Figure 1. An online learning experience begins at the starting point (first day of the course) and ends at the ending point (last day of the course). In between those two points, a series of learning tasks are presented to provide learners with diverse learning experiences. As the course continues, the learner continues to interact with learning tasks and eventually accumulates learning experiences by completing the learning tasks (Park, 2016). Students learning experiences are built up from the previous learning tasks because learning tasks are not separated from each other as shown in the spiral area in Figure 1. Hence, to analyze behavioral interactions in online learning, both the type of learning tasks and the time-on-task must be analyzed simultaneously. In this paper, the researcher gathered and utilized Web log data to visualize the behavioral interaction patterns of online learners during the course of a semester and to compare the behavioral interactions between two online courses requiring different types of learning tasks.
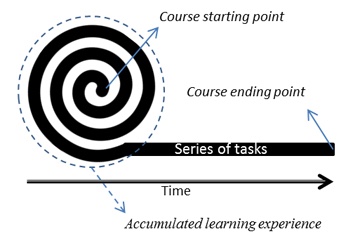
Figure 1. Online learning experience - time and tasks.
In this study, the researcher purposefully selected two online courses as units of analysis. The two courses were purposefully selected because of the different learning approach that each course employed to design authentic learning activities and the extent to which technology was used. Course A activities were designed based on the constructivist learning approach while Course B activities were designed based on the constructionist learning approach. Both the constructionist approach and constructivist approach hold the basic assumption that students build knowledge of their own and continuously reconstruct it through personal experiences with their surrounding external realities. However, the constructionist approach is different from the constructivist approach in that constructionist learning begins with a view of learning as a construction of knowledge through constructing tangible projects or creating digital artifacts (Kafai, 2006; Papert, 1991). The title of Course A was Program Evaluation, in which the major course activities consisted of textbook reading, weekly online discussions, and a final evaluation plan proposal. Students enrolled in this course were expected to read the textbook, participate in weekly discussion activities, and complete a program evaluation plan. Course B was titled Instructional Multimedia Design/Development, which consisted of a series of hands-on tasks to design and develop multimedia materials using different multimedia authoring programs. Students were required to review related literature and tutorials on multimedia design during the semester and to create audio-based, visual-based, and Web-based multimedia materials through a series of hands-on-activities. The comparison of course requirements, key learning activities, authentic tasks, and technology use between the two online courses is presented in Table 1.
Table 1
Comparison of Course Requirements, Key Learning Activities, Authentic Tasks, and Technology use Between Courses
| Course A | Course B | |
| Course* requirements | Textbook reading & online discussion | Multimedia design/development |
| Key learning activities |
|
|
| Authentic tasks** |
|
|
| Technology use | Students utilized the following technology to share their ideas and insights via weekly discussions based on the constructivist learning approach:
| Students utilized the following technology to design and create instructional multimedia materials based on the constructionist learning approach:
|
Note. *A course in this study refers to a general online class that delivers a series of lessons and learning tasks (online lectures, readings, assignments, quizzes, design and development activities, etc.).
** Authentic tasks were designed based on 10 characteristics of authentic activities/tasks defined by Herrington et al. (2006).
Both courses were delivered via Moodle LMS and met the Quality Matters (QM) standards. Moodle is an open-source LMS that helps educators create online learning courses. It has been used as a popular alternative to proprietary commercial online learning solutions and is distributed free of charge under open source licensing (Romero, Ventura, & Garcia, 2008). QM specifies a standard set employed to certify the quality of an online course (www.qualitymatters.org). Both courses A and B in this study met the required standards for high quality online course design after a rigorous review process by two certified QM reviewers.
As two courses with different online learning tasks were purposefully selected, 22 graduate students who were enrolled in two 8 week long online courses participated in this study. Twelve students were enrolled in Course A, and 10 students were enrolled in Course B. Excluding four students, two who dropped from each course due to personal reasons, the data reported in this paper concern 18 participants, 10 students (4 male and 6 female) in Course A and 8 students (all female) in Course B, with a mean age of 32.60 years ( SD = 5.76) and 35.25 years ( SD = 9.66), respectively. The average number of online courses the study participants had taken previously was 11.40 ( SD = 4.88) for Course A and 11.38 ( SD = 12.28) for Course B, indicating no significant difference between the two courses. However, it should be noted that the number of students who had not previously taken more than 10 online courses was higher in Course B (five participants) than in Course A (three participants). Fifteen of the 18 participants were teachers: five taught elementary school, five taught middle school, and five taught high school. Of the remaining three participants, one was an administrative assistant, one was a curriculum director, and one was an instructional designer.
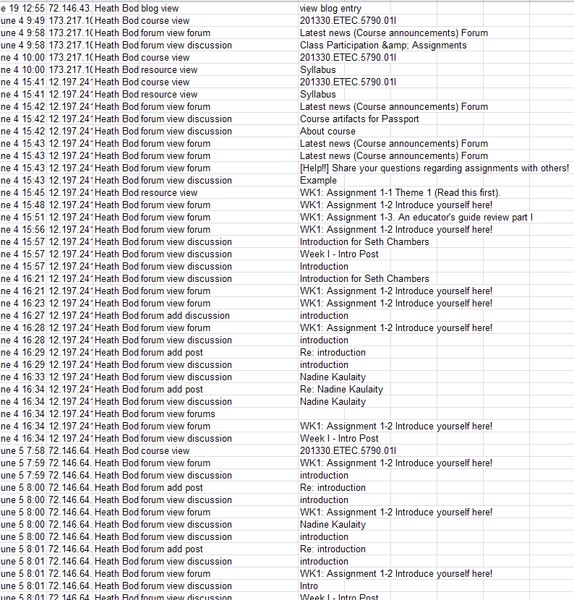
Figure 2. Example of Web log data screen.
In this study, the researcher examined behavioral interactions by utilizing students’ Web log data acquired from Moodle LMS used in this study (Figure 2). The obtained sets of data were significant for this study because they contained timestamp-sequenced interaction activities that are automatically recorded for each student with pre-determined activity categories such as view discussion, post discussion, view resources, etc. Hence, it clearly showed the type of activities each student followed in order to complete a given online learning task. The researcher also ensured the accuracy of data by following the process to decide the validity of the online behavior (Jansen et al., 2009). First, the researcher clearly defined the type of behavioral data to be analyzed based on the research questions (Table 2), and second, the researcher articulated the situational and contextual factors of the log data by cross-examining the given online tasks and recorded students activities. Lastly, the researcher checked the timestamps for each activity to confirm the time and the length of data recorded. The data were then converted to Excel file format and computed based on three semester phases for further analysis. These phases were phase 1 - beginning of the semester, phase 2 - during the semester, and phase 3 - end of the semester. An example of a Web log data screen is presented in Figure 2. The data show online learner behaviors in chronological order. Based on the type of behavioral activities, the researcher identified two categories of behavioral interactions that affect task completion: interactions with the Moodle LMS and interactions with peers. Table 2 presents the two categories of behavior interactions and example behaviors for each category.
Table 2
Categories of Behavioral Interactions and Description
| Categories of behavioral interaction | Behavior description (Operational definition) |
| Interactions with Moodle LMS |
|
| Interactions with peers |
|
Among the identified behaviors, quiz taking was excluded from the analysis because it was a behavioral interaction that only applied to Course A. Student attendance and time-on-task were collected from recorded attendance data and each student’s weekly reported time-on-task. Weekly performance scores were also collected from the course instructors and from the students with student permission. Due to the different grading systems, task scores from the two courses were converted to a 1 (minimum) to 100 (maximum) scale and combined based on the corresponding weeks for each phase.
Collected data were analyzed to answer each of the five research questions. Table 3 displays the descriptive statistics of behavioral interactions with the Moodle LMS, behavioral interactions with peers, time-on-task, attendance, and performance for each of the two courses.
A series of Mann-Whitney tests (Field, 2013), the non-parametric equivalent of the independent samples t -test, were used to compare the two types of behavioral interactions, time-on-task, attendance, and performance between the two courses. The Mann-Whitney test was selected for use in this study because the data did not meet the requirements for a parametric test, and the Mann-Whitney test has the advantage of being used for small samples of subjects, (i.e., between five and 20 participants) (Nachar, 2008).
RQ1: Do online learners' behavioral interactions with the Moodle LMS differ between a course employing authentic discussion-based learning tasks and a course employing authentic design/development-based learning tasks?
The average number of behavioral interactions with the Moodle LMS between the two courses was compared using the Mann-Whitney test. Among the three phases compared, the average number of Moodle LMS interactions in phase 1 (weeks 2/3) was significantly different, as revealed in Figure 3. In phase 1, the average number of Moodle LMS interactions in Course B (M = 32.00, Mdn = 31.50) was significantly higher than the average number of Moodle LMS interactions in Course A (M = 19.60, Mdn = 20.00), U = 12.00, z = - 2.50, p <.05, r = -.59, thus revealing a large effect size (Field, 2013). In phases 2 and 3, however, the average number of Moodle LMS interactions were not significantly different between the two courses. Nonetheless, the total number of Moodle LMS interactions between the two courses was significantly different as the total number of Moodle LMS interactions in Course B (M = 74.13, Mdn = 73.50) was significantly higher than the average number of Moodle LMS interactions in Course A (M = 59.70, Mdn = 65.50), U = 17.50, z = - 2.01, p < .05, r = -.47, indicating a medium to large effect size.
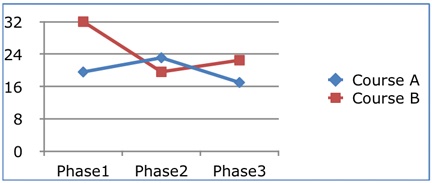
Figure 3. Average number of behavioral interactions with the Moodle LMS for each phase of the semester for two courses.
Table 3
Descriptive Statistics of Behavioral Interactions, Time, Attendance, and Performance
| Phase 1 (Weeks 2/3) | Phase 2 (Weeks 4/5/6) | Phase 3 (Weeks 7/8) | All three phases | |||||
| Course A | Course B | Course A | Course B | Course A | Course B | Course A | Course B | |
| M SD | M SD | M SD | M SD | M SD | M SD | M SD | M SD | |
| Behavioral interactionsa LMS interactions | 19.60 (5.36) | 32.00 (9.37) | 23.10 (6.72) | 19.63 (7.15) | 17.00 (5.77) | 22.50 (12.09) | 59.70 (10.46) | 74.13 (19.28) |
| Peer interactions | 64.50 (24.04) | 86.75 (42.60) | 126.30 (57.88) | 58.25 (25.39) | 65.70 (41.17) | 48.25 (22.38) | 256.50 (99.69) | 193.25 (69.77) |
| Attendanceb | 9.90 (2.99) | 10.75 (2.82) | 15.20 (3.05) | 13.50 (4.47) | 11.70 (2.21) | 9.75 (4.20) | 36.80 (7.57) | 34.00 (9.15) |
| Time-on-taskc | 375.00 (53.59) | 700.63 (549.52) | 564.00 (155.27) | 1919.38 (1928.10) | 252.50 (140.34) | 360.00 (304.26) | 1191.50 (314.80) | 2980.00 (2713.65) |
| Performance Task scored | 185.43 (11.02) | 195.00 (4.47) | 241.25 (29.71) | 283.59 (21.37) | 79.00 (15.23) | 96.43 (1.66) | 505.68 (46.31) | 575.02 (26.03) |
Note.
a Average number of interactions per phase
b Average number of course participations per phase (Logins)
c Time presented in minutes
d Scores ranging from 0 (minimum) to 200 (maximum) in phase 1, from 0 (minimum) to 300 (maximum) in phase 2, from 0 (minimum) to 100 (maximum) in phase 3
RQ2: Do online learners' behavioral interactions with peers differ between a course employing authentic discussion-based learning tasks and a course employing authentic design/development-based learning tasks?
The average number of behavioral interactions with peers for the two courses was compared using the Mann-Whitney test. Among the three phases, the average number of interactions with peers in phase 2 (weeks 4/5/6) was significantly different, as evidenced in Figure 4. In phase 2, the average number of peer interactions in Course A (M = 126.30, Mdn = 111.50) was significantly higher than the average number of peer interactions in Course B (M = 58.25, Mdn = 59.50), U = 7.00, z = - 2.93, p <.01, r = -.69, thus revealing a large effect size. However, the average number of peer interactions was not significantly different between the two courses in phases 1 and 3, nor was the total number of peer interactions between the two courses significant.
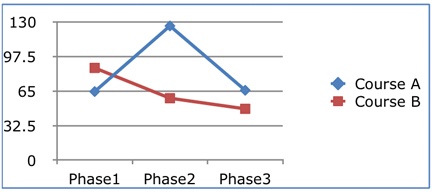
Figure 4. Average number of behavioral interactions with peers for each phase of the semester for the two courses.
The findings for both research questions 1 and 2 show the statistical comparisons of Moodle LMS interactions and peer interactions between two online courses involving different types of authentic learning tasks. To help understand the exact type of behavioral interactions and possible patterns, the researcher visualized each student's behavioral interaction pattern, as shown in Figures 5, 6, and 7. Each category of students' behavioral interactions was imported into an Excel spreadsheet with different color themes (Figure 5).
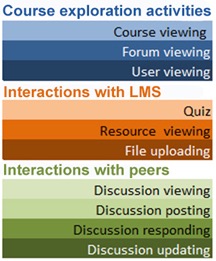
Figure 5. Legend of color themes.
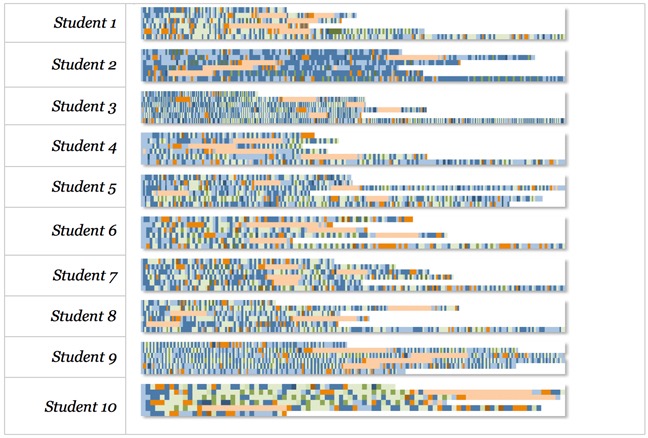
Figure 6. Behavioral interaction pattern for each individual student in Course A.
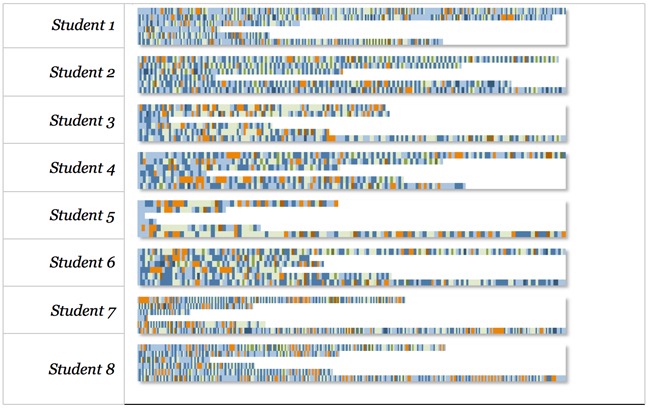
Figure 7. Behavioral interaction pattern for each individual student in Course B.
Blue colors represent a student's course exploration activities, such as course viewing and other user viewing. Brown colors represent a student's interactions with the Moodle LMS, and green colors represent a student's interactions with peers. Each square in the pattern graph represents one occurrence of the case. Each pattern line represents the total behavioral interactions that occurred in each week. Through visual representations of behavioral interactions, different patterns were identified in the two courses. Most of the students in course A showed a (![]() ) shape of behavioral patterns, while students in Course B showed a (
) shape of behavioral patterns, while students in Course B showed a (![]() ) shape of behavioral patterns. In other words, students in Course A tend to show more behavior interactions as they move toward the end of the semester, while students in course B showed higher behavioral interactions in the first week of the semester and also at the end of the semester.
) shape of behavioral patterns. In other words, students in Course A tend to show more behavior interactions as they move toward the end of the semester, while students in course B showed higher behavioral interactions in the first week of the semester and also at the end of the semester.
RQ3: Does online learners' time-on-task differ between a course employing authentic discussion-based learning tasks and a course employing authentic design/development-based learning tasks?
Time-on-task for weekly authentic tasks for the two courses was compared using the Mann-Whitney test. No significant differences were found in any of the three phases or for the entire semester (Figure 8).
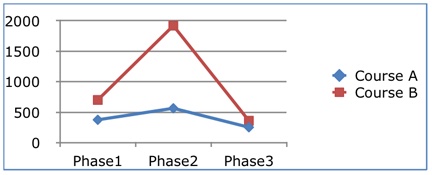
Figure 8. Average time-on-task (in minutes) for each phase for the two courses.
RQ4: Does online learners' attendance differ between a course employing authentic discussion-based learning tasks and a course employing authentic design/development-based learning tasks?
Attendance for weekly authentic tasks for the two courses was compared using the Mann-Whitney test. No significant differences were found in any of the three phases or for the entire semester (Figure 9).
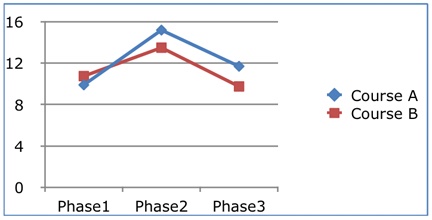
Figure 9. Average attendance for each phase for the two courses.
RQ5: Does online learners' academic performance differ between a course employing authentic discussion-based learning tasks and a course employing authentic design/development-based learning tasks?
The average task score between the two courses was compared using the Mann-Whitney test. Among the three phases compared, the average scores in phases 2 and 3 were significantly different, as displayed in Figure 10. In phase 2, the average score in Course B (M = 283.59, Mdn = 290.00) was significantly higher than the average score in Course A (M = 241.25, Mdn = 240.47), U = 9.00, z = -2.76, p <.01, r = -.65, revealing a large effect size. In phase 3, the average score in Course B (M = 96.43, Mdn = 96.43) was significantly higher than the average score in Course A (M = 79.00, Mdn = 85.00), U = 7.50, z = -2.94, p <.01, r = -.69, indicating a large effect size. However, the task scores were not significantly different in phase 1. The total task scores for the entire semester for the two courses were significantly different. The total score for Course B (M = 575.02, Mdn = 585.43) was significantly higher than the total score for Course A (M = 505.68, Mdn = 495.47), U = 8.00, z = -2.85, p <.01, r = -.67, indicating a large effect size.
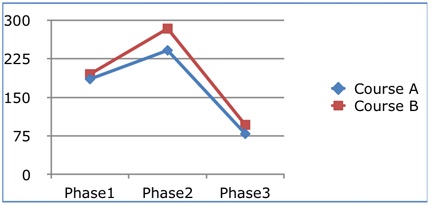
Figure 10. Average score in each phase for the two courses.
In addition to the Mann-Whitney test comparisons, a Spearman's rank-order correlation was also run to determine the relationship between all 18 students' behavioral interactions, time-on-task, and performance per week.
Table 4
Significant Correlations between Behavioral Interactions, Time-on-Task, and Performance
| Weeks | Correlation | rs(16) | p value * |
| Week2 | Discussion viewing - Discussion response | .794 | .000 |
| Week3 | Discussion viewing - Discussion response | .639 | .004 |
| Week4 | Discussion viewing - Discussion posting | .742 | .000 |
| Resource viewing - Discussion posting | .632 | .005 | |
| Resource viewing - Discussion viewing | .631 | .005 | |
| Week5 | Discussion viewing - Discussion posting | .599 | .009 |
| Resource viewing - Discussion posting | .792 | .000 | |
| Resource viewing - Discussion viewing | .703 | .001 | |
| Week6 | File uploading - Score | .650 | .003 |
| File uploading - Discussion posting | .732 | .001 | |
| Week7/8 | File uploading - Discussion posting | .622 | .006 |
| Discussion viewing - discussion response | .661 | .003 |
Note. * All correlations are significant at the 0.01 level (2-tailed).
Although no overall significant correlations were found between time-on-task and behavioral interactions, or between performance scores and behavioral interactions, there were several noticeable patterns found among behavioral interactions. For example, during the first half of the semester, strong positive correlations were found between discussion reviewing and discussion response /discussion posting behaviors. Then, during the second half of the semester, resource viewing, discussion posting, and file uploading behaviors showed strong positive correlations. Especially in week 6, students scored higher when they showed more file uploading behaviors with discussion postings.
Time flexibility and authentic tasks are two factors that affect the success of an online learning experience. However, the type of behavioral interactions students exhibit at different points when they are involved in different types of authentic tasks is not well understood. Accordingly, this study attempted to analyze and visualize the behavioral interactions of online learners at different times during the semester and compare the occurrences of these behavioral interactions in two online courses. The study found that online students exhibit different behavioral interactions when they are involved in two different authentic online learning activities. Students in authentic design/development-based learning activities demonstrated more behavioral interactions with the Moodle LMS at the beginning of the course, whereas students in authentic discussion-based learning activities exhibited more behavioral interactions with peers during the middle of the semester. Overall, attendance and time-on-task did not differ between the two courses. Understanding time flexibility as the capacity to spend time-on-task at different times of the day and week (Romero & Barberà, 2011), the results indicate that students are likely to be involved in behavioral interactions with the Moodle LMS early in the course if given tasks require authentic design/development learning activities. This finding could be viewed from the perspective of student time management. In other words, students in the design/development course tried to understand the scope of the design/development projects early in the semester so they could plan the design/development of the multimedia materials for the semester. This notion is supported by their attendance and time-on-task (Figures 8 and 9). Although students in Course B did not actively participate in behavioral interactions with peers in the middle of the semester, they attended the course regularly and spent significantly more time working on given tasks compared with students in Course A. Given the different behavioral interaction patterns found in the different authentic online tasks, the findings support the importance of designing technological learning resources at different points of the semester depending on the type of authentic learning tasks and on the needs of the student (Swan & Shin, 2005).
Another important finding of this study is that the correlations between student performance and each type of student behavioral interactions according to Spearman's rank correlation coefficients were not significant. The evidence offers the possibility of behavioral interactions being an intermediate variable, suggesting that more indicators must be examined to understand factors affecting student performance in online learning. In fact, many of the online learning analytics focus on behavioral indicators rather than on the psychological aspects of learning, such as cognitive involvement, academic emotions, and motivation. Therefore, we must seek ways to incorporate a different methodology to approach the online learning experience in a holistic way. For example, the experience sampling method (ESM) combined with learning analytics would be a good alternative method to analyze the multiple dimensions of the online learning experience.
This study analyzed the behavioral interactions of online learners and compared the differences in behavioral interactions for two online courses each with different authentic learning tasks. Since the first course was designed based on a constructivist approach, and the second course from a constructionist perspective, the analysis results showed that students in each course experienced different behavioral interactions during the semester. The findings imply that when designing an online course that involves authentic learning tasks, instructional designers need to consider optimizing learners' behavioral interaction sequence to maximize their learning effectiveness. For example, interactions with peers should be encouraged when designing an online course based on the constructive belief (Lowes, Lin, & Kinghorn, 2015). Unlike other previous studies, however, this study did not find the direct relationship between the behavioral interactions, whether with Moodle LMS or peers, and performance scores. Previous studies such as Davies and Graff's (2005) also reported no relationship between discussion forum participation and final course grades. As discussed, behavioral interactions could be an intermediate variable affected by students' cognitive involvement and motivation, thus their psychological online learning experiences also need to be considered when analyzing students' Web log data. There are several limitations to this study. First, the behavioral interaction data collected using Web logs are limited only to internal data stored in the Moodle LMS server. External communication data, such as email correspondences or conference calls, were not included in the data analysis. Second, although the study was conducted using two purposefully selected courses to provide a rich description of the behavioral pattern for each individual student, future researchers wanting to make generalizations about the findings of this study will need to increase the number of participants. Third, this study only analyzed the behavioral patterns of online learners, and thus, there is a need to examine how these behavior patterns are related to other learning experiences such as a cognitive processing and affective states. This holistic approach to understanding learning experiences will help researchers obtain a more comprehensive picture of the interactions among the cognitive processes, affective states, and behavioral patterns. With the meticulous analysis of the individual learner’s learning experience, we can gain deeper insight into ways to design the optimal online learning experience.
Allen, I. E., & Seaman, J. (2014). Grade change: Tracking online education in the United States. Babson Park, MA: Babson Survey Research Group and Quahog Research Group. Retrieved from http://www.onlinelearningsurvey.com/reports/gradechange.pdf
Arneberg P., Keegan D., Guardia, L., Keegan, D., Lõssenko, J., Fernández Michels, P., & Zarka, D. (2007). Analyses of European mega providers of e-learning. Bekkestua: NKIforlaget.
Cho, M. H., & Kim, B. J. (2013). Studentsʼ self-regulation for interaction with others in online learning environments. The Internet and Higher Education, 17, 69-75. doi: http://dx.doi.org/10.1016/j.iheduc.2012.11.001
Collis, B., Vingerhoets, J., & Moonen, J. (1997). Flexibility as a key construct in European training: Experiences from the Tele Scopia project. British Journal of Educational Technology, 28(3), 199-217.
Davies, J., & Graff, M. (2005). Performance in e-learning: Online participation and student grades. British Journal of Educational Technology, 35(4), 657-663.
Dawson, S., McWilliam, E., & Tan, J.P.L. (2008). Teaching smarter: How mining ICT data can inform and improve learning and teaching practice. In Hello! Where are you in the landscape of educational technology? Proceedings ascilite Melbourne 2008. Retrieved from http://www.ascilite.org.au/conferences/melbourne08/procs/dawson.pdf
Dringus, L. P., & Ellis, T. (2005). Using data mining as a strategy for assessing asynchronous discussion forums. Computers & Education, 45, 141-160. doi: 10.1016/j.compedu.2004.05.003
Field, A. P. (2013). Discovering statistics using IBM SPSS Statistics (4th edition). London: Sage publications.
Grace, L, J., Maheswari, V., & Nagamalai, D. (2011). Web log data analysis and mining. Proceedings of Advanced computing: First international conference on computer science and information technology, (pp. 459 - 469). Bangalore, India.
Hellwege, J., Gleadow, A., & McNaught, C. (1996). Paperless lectures on the web: An evaluation of the educational outcomes of teaching Geology using the Web. Proceedings of 13th Annual Conference of the Australian Society for Computers in Learning in Tertiary education (ASCILITE '96), (pp. 289-299). Adelaide, Australia.
Herrington, J., Oliver, R., & Reeves, T.C. (2006). Authentic tasks online: A synergy among learner, task and technology. Distance Education, 27(2), 233-248.
Jansen, B. J., Taksa, I., & Spink, A. (2009). Research and methodological foundations of transaction log analysis. In B. J. Jansen, A. Spink, & I. Taksa (Eds.), Handbook of research on Web log analysis. Hershey, PA: IGI global.
Kafai, Y. B. (2006). Playing and making games for learning instructionist and constructionist perspectives for game studies, Games and Culture 1(1), 36-40
Lebow, D., & Wager, W. W. (1994). Authentic activity as a model for appropriate learningactivity: Implications for emerging instructional technologies. Canadian Journal of Educational Communication, 23(3), 231-144.
Lowes, S., Lin, P., & Kinghorn, B. (2015). Exploring the link between online behaviours and course performance in asynchronous online high school courses. Journal of LearningAnalytics, 2(2), 169-194.
Macfadyen, L. P., & Dawson, S. (2010). Mining LMS data to develop an “early warning system” for educators: A proof of concept. Computers & Education, 54(2), 588-599.
Mahajan, R., Sodhi, J. S., & Mahajan, V. (2016). Usage patterns discovery from a Web log in an Indian e-learning site: A case study. Education and Information Technologies, 21(1), 123-148. doi: 10.1007/s10639-014-9312-1
Moller, L., Foshay, W., Huett, J. (2008). The evolution of distance education: Implications for instructional design on the potential of the web (Part 2: Higher Education). Tech Trends,52(4), 66-70.
Mostow, J., Beck, J., Cen, H., Cuneo, A., Gouvea, E., & Heiner, C. (2005). An educational data mining tool to browse tutor-student interactions: Time will tell! Proceedings of the workshop on educational data mining, Pittsburgh, USA (pp. 15-22).
Nachar, N. M. (2008). The Mann-Whitney U: A test for assessing whether two independent samples come from the same distribution, Tutorials in Quantitative Methods for Psychology, 4(1), 13-20.
National Center for Education Statistics. (2011). Distance education courses for public elementary and secondary school students: 2009-10. Washington, DC: U.S. Department of Education Government Printing Office. Retrieved from http://gsehd.gwu.edu/documents/gsehd/resources/gwuohs-onlineresources/reports/ies-nces_distanceeducationcourses-20092010.pdf
Park, S. (2015). Examining learning experience in two online courses using Web logs and experience sampling method (ESM). In B. Hokanson, G. Clinton, & M. W. Tracey (Eds.), The design of learning experience: Creating the future of educational technology. New York: Springer.
Park, S. (2016). Analyzing and comparing online learning experiences through micro-level analytics. Journal of Educational Technology Development and Exchange, 8(2), 55-80.
Papert, S. (1991). Preface. In I. Harel, & S. Papert (Eds), Constructionism, research reports and essays, 1985-1990 (p. 1). Norwood, NJ: Ablex Publication.
Parker, J., Maor, D., & Herrington, J. (2013). Authentic online learning: Aligning learner needs, pedagogy and technology. In Special issue: Teaching and learning in higher education. Issues In Educational Research, 23(2), 227-241.
Peled, A., & Rashty, D. (1999). Logging for success: advancing the use of WWW logs to improve computer mediated distance learning. Journal of Educational Computing Research, 21(3).
Roblyer, M. D., & Edwards, J. (2000). Integrating educational technology into teaching (2nd Ed.). Upper Saddle River, New Jersey: Prentice-Hall, Inc.
Romero, C., Ventura, S., & Garcia, E. (2008). Data mining in course management systems: Moodle case study and tutorial, Computers & Education, 51(1), 368-384.
Romero, M., & Barberà, E. (2011). Quality of e-learners’ time and learning performance beyond quantitative time-on-task, The International Review of Research in Open and Distance Learning 12(5).
Shea, P., & Bidjerano, T. (2014). Does online learning impede degree completion? A national study of community college students. Computers & Education, 75(2), 103-111.
Sheard, J., Albrecht, D., & Butbul, E. (2005). ViSION: Visualization student interactions online. Proceedings of the Eleventh Australasian World Wide Web Conference (pp. 48-58).
Swan, K., & Shih, L. F. (2005). On the nature and development of social presence in online course discussions. Journal of Asynchronous Learning Networks, 9, 115-136. Retrieved from http://sloanconsortium.org/publications/jaln_main
Taksa, I., Spink, A., & Jansen, B. J. (2009). Web log analysis: Diversity of research methodologies. In B. J. Jansen, A. Spink, & I. Taksa (Eds.), Handbook of research on Web log analysis. Hershey, PA: IGI global.
Valsamidis, S., & Democritus, S.K. (2011). E-learning platform usage analysis. Interdisciplinary Journal of E- Learning and Learning Objects, 7,185-204.
Van den Brande, L. (1994). Flexible and distance learning. Chichester: John Wiley & Sons.
Veletsianos, G., & Doering, A. (2010). Long-term student experiences in a hybrid, open-ended and problem based Adventure Learning program, Australasian Journal of Educational Technology, 26(2), 280-296
Wallace, R. M. (2010). Online learning in higher education: A review of research on interactions among teachers and students, Education, Communication & Information 3(2), 241 - 280. doi: 10.1080/14636310303143
Wei, H.C., Peng, C., & Chou, C. (2015). Can more interactivity improve learning achievement in an online course? Effects of college students’ perception and actual use of a course-management system on their learning achievement. Computers & Education, 83, 10-21.
![]()

Analysis of Time-on-Task, Behavior Experiences, and Performance in Two Online Courses with Different Authentic Learning Tasks by Sanghoon Park is licensed under a Creative Commons Attribution 4.0 International License.