Rob Koper
Open University of the Netherlands
How do (potential) students differ in their preferences for the organization of online and distance courses and programs, can these differences be grouped into preference profiles, and are there any associations between these profiles and variables, such as achievement and dropout, that are relevant for the promotion and design of online and distance teaching?
In this study, three groups (enrolled students, N=1939; prospective students, N=296, people in the target group of the course or program, N=255) completed a survey consisting of 28 items with which to identify their preferences. Various significant differences in preferences between the groups were found in the item scores. Exploratory factor analysis resulted in five meaningful factors that were used to create 32 preference profiles that are identified by the dichotomized scores on the factors. In this way, the profiles conserve their dimensional relationship instead of presenting profiles as distinct types. The factors in which student preferences differ are: collaboration (group work versus self-study), pacing (fixed time schedule versus flexibility in time and tempo), the degree to which the study has a practical orientation, the degree of proactive (versus reactive) teaching and a preference for indepth learning versus superficial learning.
Significant associations have been found between preference profiles and the discipline in which the student group studies, the type of program (e.g., bachelor, master), and the number of study points obtained in the last year per discipline. The results indicate that the enrolled students are more aligned to the characteristics of the teaching-learning process than the other two groups.
Keywords: Open universities; higher education; distance education; open learning
What are the differences in learning preferences of (potential) students in online and distance education, and what impact do they have on factors such as enrollment decisions, dropout, satisfaction and achievement? It is evident that when a course or program attracts students with non-fitting preferences this will give rise to frictions, that is, inefficiencies in the process. Students may, for example, experience difficulties with the time and tempo constraints, the (lack of sufficient) communication with tutors and peers or with the amount of self-directedness required. The result is education that is not as effective, efficient or satisfying than it could have been had it attracted students with fitting preferences. Especially in the case of distance education this could be a problem, because it tends to attract heterogenous groups of, mostly adult, learners with conflicting preferences. Simonson et al. (2012, p. 5), for instance, note that students state that their first choice is not to learn at a distance, but at the same time they are increasingly demanding to learn at a distance because of other competing preferences, like a preference for more freedom in terms of time or place.
There is little knowledge available about the differences in preferences and their interplay. Artino (2010, p. 272), for instance, states that “Notwithstanding the growth of online learning, little is known about the personal factors that predict student decisions to enroll in online courses”, and Naidu (2013, p. 268) notes that “In most educational settings, very little attention is paid to analyzing and understanding learners and their learning context before any learning and teaching occurs”. More knowledge about the preferences of learners is needed for a proper design of online and distance education, that is, being aware and taking care of dominant differences in the appreciation for certain types of learning processes to keep students satisfied with the process and outcomes. However, it is not only the design that is affected, it is also important to focus on adequate promotion and intake methods to attract and select the right students. The attracted population should fit the design and vice versa.
What is known in the literature relating to student preferences or characteristics? There have been studies on the disparity in perceptions of teacher and students with respect to course effectiveness (Seok, DaCosta, Kinsell & Tung, 2010). Or, on the expected differences in cognitive style (Sadler-Smith & Riding, 1999) or learning style (Coffield et al., 2004) with the underlying assumption that learners will have a preference for certain instructional methods. Pashler, McDaniel, Rohrer and Bjork (2008) analysed this claim and concluded that the evidence is too poor to justify the use of learning styles in educational practice. Also, quite some research has been conducted in the field of student satisfaction, for instance Walker and Fraser (2005) and Clayton (2007) developed surveys to access the satisfaction of students with the online learning environment using three social dimensions distinguished by Moos (1974): relationship, personal development and system maintenance and change. Many studies can be found that compare the satisfaction of classroom learning to online and distance learning (e.g., Paechter & Maier, 2010; Allen, Bourhis, Burrell & Mabry, 2002; Russell 2002; Merisotis & Phipps, 1999). It should be noted that satisfaction is related to preference, but not similar. Satisfaction deals with the contrast between expectations and experience (Churchill & Surprenant, 1982). Expectations are anticipated qualities of specific events, products or services. People with low expectations about the quality of a certain product may experience a high level of satisfaction when it offers more than they expected, especially when it comes closer to their preferences. Preferences are measured more in general as an attribute of persons (“Tomorrow I expect rain, but in general I prefer sunshine”). Because of this difference, in contrast to satisfaction, preferences can be measured before students are enrolled.
Student satisfaction is a factor in the management of educational quality. It is for this reason that one can expect a lot of quantitative and qualitative information to be available in the grey literature, especially in management, evaluation and marketing reports. A good example concerns the yearly marketing reports of Aslanian and Clinefelter (see e.g., 2013). These provide descriptive data about the demands and preferences of online college students in the US, like the perceived value of online study, desired institution and program features, preferred mode of study and demographic factors.
In this paper we will explore systematic differences in the preferences of (potential) students that are directly relevant to the promotion, selection and design of online and distance courses and programs.
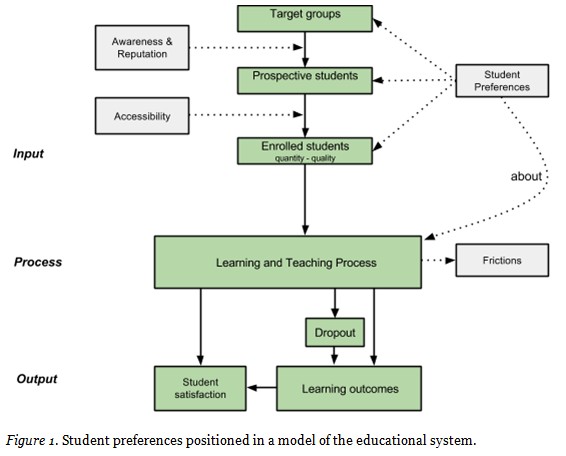
To define the concept of student preference, we will position it in the context of a systems model of the educational process (Figure 1).
The teaching learning process, a process that aims to transform the knowledge, skills and attitudes of the input (enrolled students) into certain outputs is found at the centre. Interesting outputs are the satisfaction of the students with respect to the process, the number of dropouts, the learning outcomes and accredited outcomes, like degrees. Most of these output measures are dependent on a time frame, the size of a program, or a fixed period like a month or a year. The learning and teaching process can be described at different aggregation levels, for instance a workshop, a course, a degree program, a school, an institute or a region. We regularly refer to ‘a program’ in the remainder of this text, but this term can be replaced by other educational entities at other aggregation levels.
People generally pass through several stages before they become enrolled students. In the transition from being an unaware member of the target group for the program to becoming a prospective student, the first step involves someone becoming aware of the program and having an interest in it. The reputation of the institute is also important. Aslanian and Clinefelter (2013) reported that the number one factor for students to select an online program is the overall reputation of the college or university. In the transition from a prospective student to an enrolled student, the accessibility of the program for the prospective student is of importance. For example, Muilenburg and Berge (2005) identified the following barriers to online learning: in the first place, administrative issues like the lack of sufficient academic advisors online, a lack of communication of clear expectations and difficulty contacting academic or administrative staff. This is followed by barriers regarding social interaction (e.g., afraid of being isolated), academic skills, technical skills, learner motivation (including procrastination), time and support for studies, cost and access to the Internet, and technical problems, respectively. Some of these are already in play in the transition from prospect to enrolled student, and some are experienced during the process.
The student preferences that are under study relate to preferences for the characteristics of the learning and teaching process, independent of the specific objectives, discipline, content, degrees and technologies. The focus is on ‘how’ students want to learn in an educational context and not on ‘what’, ‘why’ or ‘with what’.
Student preferences regarding the learning and teaching process can be measured at any time for every group: target group, prospective students and enrolled students. Preferences are of influence in the transition processes: It is important in the transition towards a prospective student that a student finds some aspects of the teaching learning process in the program attractive. In the transition towards an enrolled student, the prospective student decides between alternatives based on a perceived optimal match of the program with their, sometimes conflicting, preferences (Simonson et al., 2012).
In an ideal situation, the target group is familiar with the program, the program offers the target group attractive features compared to other alternatives, an institute with a good reputation offers the program and the program is not appealing or selective for people who do not match the envisaged target group. The result of this process should be that the quantity and quality of the enrolled student population optimally match the design characteristics of the program.
Which aspects of the learning and teaching process should we focus on when defining student preferences? The most important criterium that we used was that a preference should refer to a changeable aspect of the teaching and learning process with a direct impact on the way the student has to organise and approach his/her study activities. It should furthermore focus on how the process is planned and organised, not on specific technological or physical aspects of the learning environment. We selected the following categories of variables for the exploration of student preferences.
1. Preferences for functional aspects of the learning and teaching process
The functional aspects of a learning environment can be grouped in terms of its social aspects (how visible are the peer students and do we expect to work in groups or individually), its teaching aspects (how visible and proactive is the teacher) and its cognitive aspects (creation of meaning and practical relevance). This grouping coincides with the aspects of the community of inquiry framework theory (Garrison, Anderson & Archer, 2001). With respect to group work, online and distance teaching courses and programs can vary considerably in this respect. Some are based on social exchange and peer support, some on independent self-study and some are based on virtual classes. With respect to proactive teaching, this aspect is highly valued by learners, but is limited in most traditional, self-study based, distance teaching. Swan (2001, p. 316) states that her findings “...highlight the importance of student-teacher interactions in asynchronous online environments. Students who do not have adequate access to their instructors feel they learn less and are less satisfied with their courses.” And, with respect to the cognitive aspects, some courses and programs are directly related to practice and some more to theoretical principles. People can differ in preferences for this orientation.
2. Preferences for the structure of the teaching learning process
The learning and teaching process can be planned and structured in different ways. For instance, the years can be organised in semesters, courses start at a fixed time or have continuous enrollment, the number of test attempts offered and the grouping of students (individual, study groups, classes, etc.).
3. Preferences in the approach to learning in the learning and teaching process
People can use different strategies when learning. Sometimes they are focussed on higher-order learning, referred to as deep learning (Marton & Säljö, 1976; Ohlsson, 2011), and sometimes the approach is more shallow and strategic, with the students only performing activities that are needed to attain the required outcomes. The learning and teaching process can be organised to stimulate deep learning, providing opportunities for students to explore new directions, and create and test meaning. Garrison and Cleveland-Innes (2005) have reported that teacher presence in particular is a critical factor for deep learning.
4. Preferences for temporal aspects of the learning and teaching process
A process takes place in time, and the temporal aspect in online and distance education is a strength and a weakness at the same time. Many providers of online and distance courses and programs provide a large degree of flexibility in time and tempo because this is the added value they can offer to attract nontraditional, adult, mostly part time students who also have other obligations in addition to studying. However, not everybody has a preference for, or is ready for independent, self-paced, self-directed learning (Samarawickrema, 2005). We expect that the majority of distance learners prefer to study in their own tempo and time, but that there are also some learners who need and prefer a more structured tempo that helps them to manage priorities.
It is expected that there are many differences between students regarding these preference variables, so the next question is whether it is possible to group the preferences into a set of student preference profiles (SPPs). Several methods for profiling are available. For example, methods in the field of data mining like the Cross Industry Standard Process for Data Mining (CRISP-DM, Shearer, 2000) in which several steps are taken to analyse information into profiles from large databases. Another approach is the use of ‘persona’ (Cooper, 1999; Nielsen, 2013), a clustering technique in which relevant user groups are represented as fictitious archetype persons with descriptive data, like a name, photo, characteristics that provide an easily communicated picture of the stereotype. These personas are used in usability research and in marketing. The advantage of the persona approach is that it is concrete and appealing to people. One of the disadvantages is that the categories are experienced as distinct types instead of persons that are classified on several dimensions. The problem with type theories is discussed by Pashler, McDaniel, Rohrer and Bjork (2008) in the context of learning styles. So, the approach taken in this paper is to score preferences on multiple dimensions and to avoid a classification into distinct types.
When the SPPs are available, we envisage that they can be applied in various ways. First of all, they can be used to explore relationships between preference profiles and factors like achievement: Are some student groups more successful than others in a given educational course or program? The expectation is that when a course or program does not fit the preferences of a person, this person has a lower chance to enroll into the program, will have a higher chance to drop-out or will be dissatisfied with aspects of the education. The learning outcomes are expected to be more dependent on the specific learning and teaching process than on the preferences. Secondly, they can be used as a factor in the (re-)design and runtime adaptation of courses and programs to (better) fit the preferences of the students and thirdly, they can be used to better communicate to the intended target population in order to enroll students that have a good fit with the characteristics of the learning and teaching process.
In summary, the research questions in this study are:
The next paragraphs describe research into finding preference profiles and the exploration of the association with other variables.
Enrolled students (N=1939, 58% woman, Mage= 45 years, age range: 17-85 years; Mhours of work=33; married: 73%; children: 57%) were recruited from the students of the Open University of the Netherlands (OU) with active student rights in the period March 2013-March 2014. The students of the OU, a public distance teaching university, are studying for a bachelor (52%) or master degree (18%), a premaster (9%) or follow one or more courses or short programs for post-initial education (21%). The dominant teaching and learning process is characterised as follows: open admission for bachelor students, freedom of place, time and tempo; students study individually, can start any time they want in the year; have three attempts on preliminary exams and the teachers are not proactive. Major study motives for students are: personal development (86%), better chance for a (new) job (46%) and studying as a leisure activity (40%). Employment: 60% paid employment; 11% run a business; 10% unemployed; 7% pension and 3% unable to work.
Prospective students (N=296 , 60% woman, Mage= 44 years, age range: 17-80 years; Mhours of work=34; married: 72%; children: 61%) were recruited from people who have requested information about study possibilities at the OU in the period October 2013-March 2014.
Target group participants (N=255 , 53% woman, Mage= 46 years, age range: 18-69 years) were recruited with the help of the company MWM2 (http://www.mwm2.nl) and were selected based on the criteria: >17 years and intermediate vocational training or higher. The highest degree obtained by the participants was: 12% intermediate vocational education, 15% pre-university education, 44% higher vocational education, and 29% at the university level.
Participants in three groups were recruited to join a panel for multiple surveys in the coming year. Upon agreeing to participate, they filled in an initial questionnaire asking for demographic data. Survey data were collected in the period April 20th - May 13th, 2014.
The survey developed contained Likert items in Dutch (5-points; starting with ‘I find it attractive ...’ and scores ranging from completely agree to completely disagree): 6 items (of which 4 open items) on structure preferences, 11 items on functional preferences; 5 items on the approach to learning and 5 items on the temporal aspects. In addition, some questions concerned the communication mode and learning analytics for purposes other than this study. A copy of the survey can be retrieved at: http://tinyurl.com/preference-profiles.
Additional data from the student administration, like the field of study, number of courses enrolled, the number of courses completed, start year at OU, number of study points gained overall and in the last year, were added for each of the students with known student numbers. There were some respondents with missing student numbers, no additional data from the student administration could be added for this group (n=335). The total number of student cases with additional data is 1604.
SAS JMP 11 was used to analyse the data. First, the dataset was prepared for analysis, for example, the inverted scales were reversed again, then some general descriptive statistics were generated, followed by exploratory factor analysis (cf. Hatcher & O’Rourke, 2013) on the items that were related to structural, functional, temporal and approach to learning preferences. The factors were used to create factor based scales by averaging the items scores per factor per person, maintaining the 5-point scale for ease of interpretation. The scores were then digitized to create interpretable multidimensional preference profiles, that is, a score higher than the scale mean (3) was assigned a ‘1’ and a score equal to the mean or lower a ‘0’. Each person was assigned a preference profile with the ones and zeros assigned in order of the personal values of the factors. For example, a person could have a profile of 0-1-1-1-1 on a 5 factor solution, meaning that the person scored 3 or lower on the first factor and higher than 3 on the other factors in order of variance explained. In this way, each person becomes a rather easy to interpret profile, and the relative position on multiple dimensions are still visible.
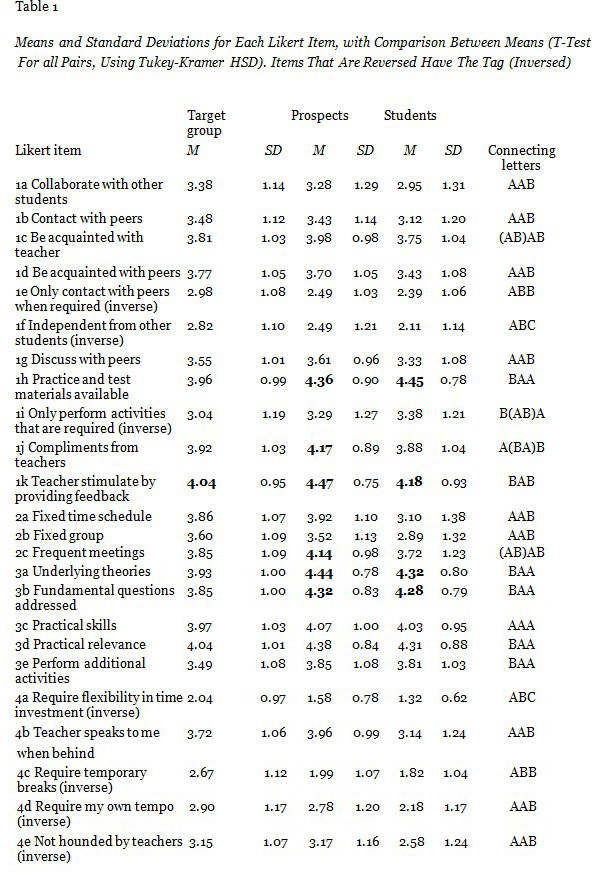
Item numbers refer to the preference categories: 1a..k: functional; 2a..c: structure; 3a..e: approach to learning; 4a..e: temporal. Levels not connected by the same letter are significantly different. Extreme values (<2 or >4) are bold.
An alpha level of .05 was used for all analyses. Table 1 provides an overview of the means and standard deviations on each item. As can be seen by the connected letters, at least one of the means differs for most items, except 3c (practical skills): Participants in each group want the education to include to learn practical skills. The mean of item 4a (require flexibility in time investment) differs in the three groups: Students want more flexibility than prospects and prospects more than the target group.
With respect to variance, the full range of values (1...5) are selected by the participants within each group for all items indicating that individual preferences differ in the full range.
The results of the open questions are:
1. mean and max. number of study hours available per week (N=2,485; Mmean/max=11/19; SDmean/max=6.5/10.8; no sign. diff between groups);
2. prefered min. and max. number of participants in a study group (N=1,082; Mmin/max=5.5/12.2; SDmin/max=2.8/7.3; no sign. diff between groups);
3. statistically, the min. and max. number of meetings prefered per 3 month differs significantly per group: students (N=1,278; Mmin/max=2.4/5.0; SDmin/max=1.8/3.4); prospects (N=237; Mmin/max=2.9/6.5; SDmin/max=1.7/4.5) and target group (N=180; Mmin/max=4.2/8.8; SDmin/max=4.9/10.0). Enrolled students want fewer meetings.
The Kaiser Meyer Olkin Sampling Adequacy (MSA) was calculated to inspect the sampling adequacy. In this study, the MSAs for individual variables ranged from 0.66 to 0.95. The MSA for the entire matrix was 0.88. Three items scored below the 0.80 meritorious level (resp. 0.65, 0.73 and 0.76), but none below the unacceptable 0.5 level (Kaiser & Rice, 1974).
The responses to the items in the survey underwent exploratory factor analysis using squared multiple correlations as prior communality estimates. The maximum likelihood method was used to extract the factors, followed by a promax (oblique) rotation. The scree test suggested 5 meaningful factors so only these factors were retained for the rotation. Interpreting the rotated factor pattern, an item was interpreted to load on a factor when the factor loading was > 0.397. With this value, most items loaded on one factor and did not on any other. The exception is item 4b that loaded on factor 2 (0.43) and 4 (0.47). The items and factor loadings are presented in Table 2.
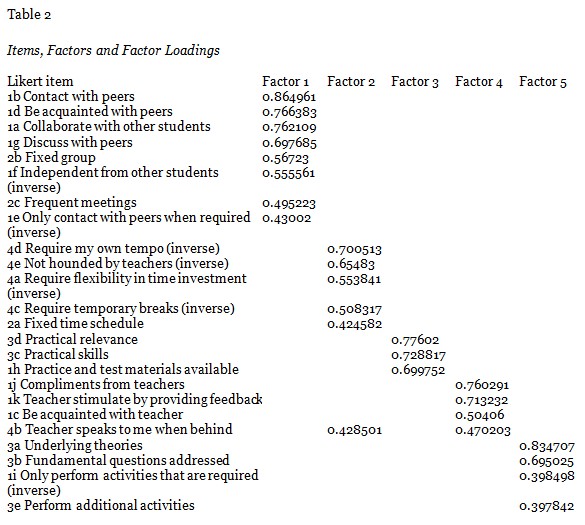
The names that best fit the factors are: factor 1: Collaboration with peers and teachers (versus self-study); factor 2: Pacing (versus flexible time and tempo); factor 3: Practical orientation (versus theoretical orientation); factor 4: Proactive teacher (versus reactive teacher); factor 5: Deep learning (versus superficial learning).
The factors were not expected to be independent of each other, so an oblique rotation was used. The Pearson correlation coefficients between the factors are presented in Table 3.
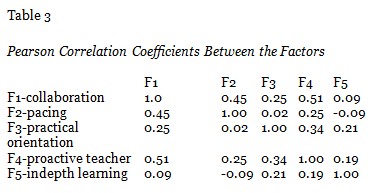
F1, F2 and F4 in particular are correlated: More preference for collaboration is associated with more preference for pacing and a proactive teacher.
Based on the loading of the items on the factors, factor-based scales were calculated that estimate the participants scores on the underlying factor. This was calculated by averaging the scores on the items that are loading on each factor, with the exception of item 4b that was not used. The scales have the same value as the individual items, ranging from 1-5 (Table 4 summarizes statistics).
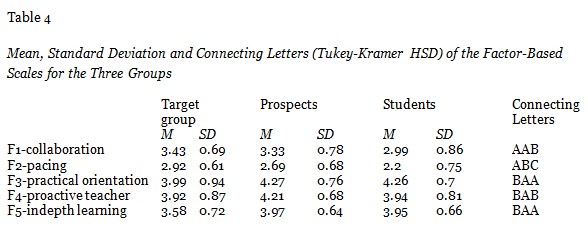
Students have significant lower preferences on collaboration and pacing. The target group has lower preference for practical orientation and deep learning. Prospects have higher preferences for proactive teachers. All have lower preference than the mid score ‘3’ for pacing (ptarget group< 0.0245; pprospects< 0.0001; pstudents< 0.0001).
To create a preference profile, the factor based scores are digitized for ease of interpretation: ‘1’ is assigned for a score > 3, else ‘0’ is assigned. The name of the profile is made up of the connected zeros and ones for each factor in order of F1-F5. In this way, five tuples are created, e.g. <1-0-1-0-1>, expressing that the person concerned has a score higher than 3 on factor 1, 3 and 5 and 3 or lower on factor 2 and 4. Interpretation would be: preference for collaboration, no preference for pacing, preference for practical orientation, no preference for proactive teacher and preference for indepth learning. In this way 25=32 different preference profiles are distinguished. The results are summarized in Table 5 with an informal description of each profile. For the descriptions the following naming conventions are used (X is 1 or 0): 1-1-1-1-1: active learning; 0-0-0-0-0: passive learning; 0-X-X-X-X: self-study; 1-0-X-0-X: knowledge exchange.
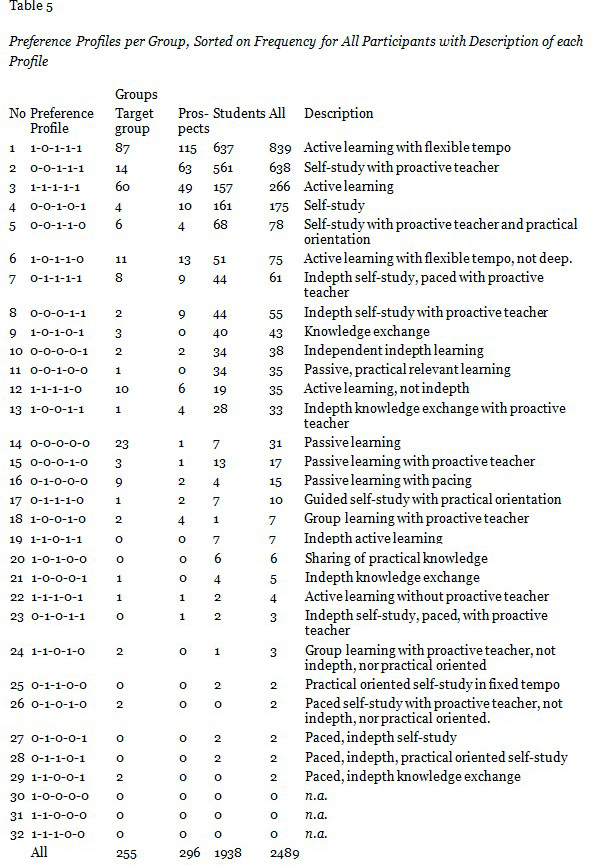
Of the 32 profiles, 17 have a frequency of more than 10 and 4 of more than 100. The top 3 is the same for all groups. The fourth position is different for the three groups.
No significant associations have been found between preference profiles and gender, age, employment, number of work hours, highest degree obtained, marital status or study motives.
There are significant differences in achievement, as measured by the number of study points (ECTS, 1 point is appr. 28 study hours) attained last year between the top 4 preference profiles. The mean and confidence intervals with connecting letters (Tukey-Kramer HSD) are:
- Profile 0-0-1-0-1 (M=10.6; 95% CI [8.7,12.5]; Letter: A);
- Profile 0-0-1-1-1 (M=9,7; 95% CI [8.7,10.6]; Letter: A);
- Profile 1-1-1-1-1 (M=8.13 ; 95% CI [6.3,10.0]; Letter: AB); and
- Profile 1-0-1-1-1 (M=7.8; 95% CI [7.0,8.6]; Letter: B).
The self-study profile attains more study points than the active learning with flexible tempo profile.
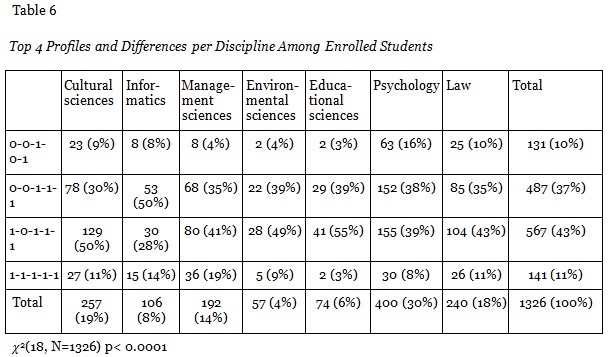
Table 6 summarizes the (significant) differences in preferences in preference profile per discipline. Notable is that Informatics students most often have 0-0-1-1-1 (self-study with proactive teacher). This is 1-0-1-1-1 (active learning with flexible tempo) for the other sciences. Active learning (1-1-1-1-1) is seen most often in management sciences.
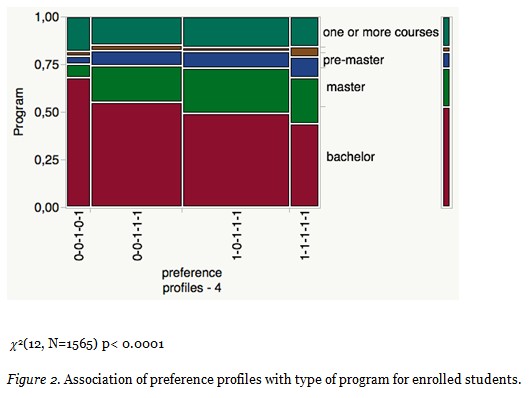
Also significant differences can be found between the preference profiles and the type of program enrolled students study (Figure 2). Note that the self-study profile occurs more in the bachelor. The masters shows the collaborative profiles [1-x-1-1-1] more often.
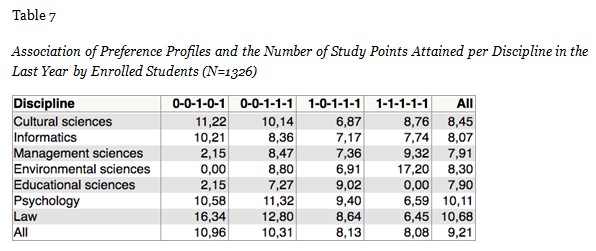
Associations are also found on the number of study points obtained in the last year by enrolled students in the various disciplines and the preference profiles (Table 7). The differences are significant in the field of law (p<0.02; connecting letters resp. A(AB)BB for the 4 profiles). For the others, the variance is too high relative to the number of cases to attain sufficient power. In law, the preference profiles with self-study characteristics are obtaining more study points per year.
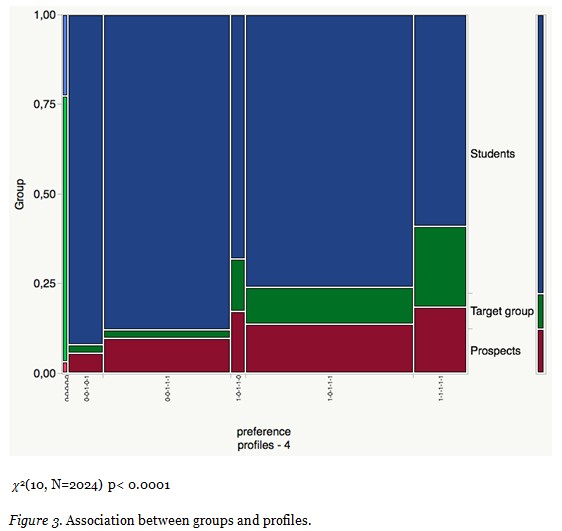
In Figure 3 differences are shown that could be relevant for the conversion from target group to prospect to enrolled student. In this case, the target group and prospects have a higher preference for active learning (with and without pacing) than enrolled students.
In this study, a method is created to specify the differences in the learning preferences of (potential) students in online and distance education. Having these preference profiles is of importance for a better communication with prospective students, and for being aware of possible frictions between student preferences and the organisation of the actual process to reduce these frictions where possible.
On the basis of this study, it is proposed to specify preference profiles on 5 dimensions: collaboration versus self-study, pacing versus flexibility, practical orientation versus theoretical orientation, proactive versus reactive teaching and indepth versus superficial learning. The profiles are named by presenting them as a dichotomised, ordered list of these five dimensions, that is, 5-tuples. Specifying the differences in this way instead of sorting them into categories, as is done with personas, makes the relationships between the profiles visible.
First an ad hoc categorisation is presented based on systems analysis, using distinctions in functional, temporal, structural and orientation of the teaching learning process. An exploratory factor analysis revealed 5 underlying dimensions that are used to structure the preference profiles: collaboration, pacing, practical orientation of the education, how proactive a teacher is and whether the course or program supports indepth learning. By positioning each student on these dimensions, their preferences can be summarized in a multidimensional profile, that is, their position is scored on the 5 dimensions and not in distinct types or categories that blur the relationship between the types. After having built the profiles, some relationships with the four most dominant profiles and other variables were explored. This exploratory study showed that there are differences in the number of study points attained by students with a specific profile. Students with a self-study profile attained more study points than students with a preference for collaborative work in the context of the OU. It is not expected that a fitting preference has any direct relationship with achievement: It is expected that this is the result of the quality of the teaching and learning process itself. How could this be explained?
Given that the OU delivers its education dominantly in the 0-0-x-0-x format and sometimes in 0-0-x-1-x, it could be expected from the conceptual model presented in Figure 1 that people who are enrolled with conflicting preferences, will encounter frictions during studying. It is expected that these frictions will make their study process less efficient, less satisfying and create a higher chance of dropping out. The finding that the best fitting profiles perform best is in line with this expectation. In future research it is necessary to focus specifically on these frictions: To what extent do they occur, do preferences change during the process, and what is the exact effect of a friction? And also, how can these frictions be prevented? Can it be reduced by better communication to prospective students, or by designing courses and programs that are adaptable to, or acceptable for, the major differences in these five factors? A difficult additional question is whether some aspects of the teaching and learning process are normative instead of organizational in nature. For instance, to build collaboration skills or indepth learning could be seen as an important output of academic study and a rationale to design the process along these lines. It is unclear what should happen in this case: keep out non-fitting students, convince them that they should change their preference, create a smart design that solves the frictions, and so on. This question too should be studied in more detail in the future.
Rieny van den Munckhof is acknowledged for her contributions to the data sampling in this work, like the setup and maintenance of the panels in MWM2 and the preparation of the data files for analyses. Astrid Kokkelkorn is acknowledged for her help in adding additional student performance data. Luuk Koper is acknowledged for his contributions in facilitating the technical setup of the survey system.
Allen, M., Bourhis, J., Burrell, N., & Mabry, E. (2002, 12). Comparing student satisfaction with distance education to traditional classrooms in higher education: A meta-analysis. American Journal of Distance Education, 16(2), 83-97. doi: 10.1207/S15389286AJDE1602_3
Artino Jr, A. R. (2010). Online or face-to-face learning? Exploring the personal factors that predict students’ choice of instructional format. The Internet and Higher Education, 13(4), 272-276.
Aslanian, C.B., Clinefelder, D.L. (2013). Online college students 2013: Comprehensive data on demands and preferences. The Learning House and Aslanian Market Research. Retreived at 26 Sept. 2014 from http://www.learninghouse.com/wp-content/uploads/2013/06/Online-College-Students-2013_Fi
Churchill Jr, G. A., & Surprenant, C. (1982). An investigation into the determinants of customer satisfaction. Journal of Marketing Research, 491-504.
Clayton, J. (2007). Development and validation of an instrument for assessing online learning environments in tertiary education: The Online Learning Environment Survey (OLLES). Curtin University of Technology, Perth.
Coffield, F., Moseley, D., Hall, E., & Ecclestone, K. (2004). Learning styles and pedagogy in post-16 learning. A systematic and critical review. London: Learning and Skills Research Centre.
Cooper, A. (1999). The inmates are running the asylum: Why high-tech products drive us crazy and how to restore the sanity (Vol. 261). Indianapolis: Sams Pub.
Garrison, D. R., Anderson, T., & Archer, W. (2001). Critical thinking, cognitive presence, and computer conferencing in distance education. American Journal of Distance Education, 15(1), 7-23.
Garrison, D. R., & Cleveland-Innes, M. (2005). Facilitating cognitive presence in online learning: Interaction is not enough. The American Journal of Distance Education, 19(3), 133-148.
Hatcher, L., & O’Rourke, N. (2013). A step-by-step approach to using SAS® for factor analysis and structural equation modeling (2nd ed.). Cary, NC: SAS Institute Inc.
Kaiser, H. F., & Rice, J. (1974). Little Jiffy, Mark IV. Educational and Psychological Measurement, 34, 111-117.
Moos, R. H. (1974). Systems for the assessment and classification of human environments: An overview. In R. H. Moos & P. M. Insel (Eds.), Issues in social ecology: Human milieus (pp. 5–29). Palo Alto, CA: National Press Books.
Muilenburg, L. Y., & Z. L. Berge. 2005. Student barriers to online learning: A factor analytic study. Distance Education, 26(1), 29–48.
Naidu, S. (2013). Instructional design models for optimal learning. In M.G. Moore (Ed.) Handbook of distance education (pp. 268-281). New York: Routledge.
Nielsen, L. (2013) Personas. In Soegaard, Mads and Dam, Rikke Friis (Eds.). The encyclopedia of human-computer interaction (2nd ed.). Aarhus: The Interaction Design Foundation.
Ohlsson, S. (2011). Deep learning: How the mind overrides experience. Cambridge: Cambridge University Press.
Paechter, M., & Maier, B. (2010). Online or face-to-face? Students’ experiences and preferences in e-learning. The Internet and Higher Education, 13(4), 292-297.
Pashler, H., McDaniel, M., Rohrer, D., & Bjork, R. (2008). Learning styles concepts and evidence. Psychological Science in the Public Interest, 9(3), 105-119.
Marton F. & Säljö R. (1976) On qualitative differences in learning. I – Outcome and Process. British Journal of Educational Psychology, 46, 4-11.
Merisotis, J. P., & Phipps, R. A. (1999). What’s the difference?: Outcomes of distance vs. traditional classroom-based learning. Change: The Magazine of Higher Learning, 31(3), 12-17.
Russell, T. (2002). “The no significant difference phenomenon” as reported in 355 research reports, summaries and papers – a comprehensive research bibliography on technology for distance education. Retrieved July 20, 2003 from: http://teleeducation.nb.ca/nosignificantdifference/
R. Gayani Samarawickrema (2005) Determinants of student readiness for flexible learning: Some preliminary findings. Distance Education, 26(1), 49-66.
Seok, S., DaCosta, B., Kinsell, C. Tung, C. (2010). Comparison of instructors’and students’perceptions of the effectiveness of online courses. Quarterly Review of Distance Education, 11(1), 25-36.
Sadler-Smith, E., & Riding, R. (1999). Cognitive style and instructional preferences. Instructional Science, 27(5), 355-371.
Shearer C. (2000). The CRISP-DM model: the new blueprint for data mining. J Data Warehousing, 5, 13—22.
Simonson, M., Smaldino. S., Albright, M., & Zvacek, S. (2012). Teaching and learning at a distance: Foundations of distance education (5th ed.). Boston, MA: Pearson.
Swan, K. (2001). Virtual interaction: Design factors affecting student satisfaction and perceived learning in asynchronous online courses. Distance Education, 22(2), 306-331.
Walker, S. L., & Fraser, B. J. (2005, 12). Development and Validation of an Instrument for Assessing Distance Education Learning Environments in Higher Education: The Distance Education Learning Environments Survey (DELES). Learning Environments Research, 8(3), 289-308. doi: 10.1007/s10984-005-1568-3
© Koper