
|
David J Harrison
University of Nevada, Reno, United States
Online educational videos disseminated content for a university pre-service teacher internship program. Placed within an online course management system, the videos were accessed by 202 interns located in several Western U.S. states. To ascertain the interns’ subjective experiences of the online course and videos to assist in the evaluation of the course, the researcher analyzed qualitative survey data in the form of constructed response items using a new qualitative-to-quantitative protocol. Based on phenomenological and grounded theory methods, this protocol was designed to handle the large amount of subjective constructed responses, allowing the inductive understanding of the overall experiences of a common phenomenon. The responses provided critical information that is useful for instructional designers, online educators, and educational video producers. The data suggest:
Keywords: Online education; blended learning; educational videos; grounded theory; subjective experiences
Online learning in higher education is outpacing the increasing enrollments in traditional face-to-face classes (Allen & Seaman, 2007; 2013), with 21 million postsecondary students in the United States enrolled in online courses (Allen & Seaman, 2013). Blended learning, defined and structured in a number of ways (Picciano, 2006; Aycock, Garnham, & Kaleta, 2002), capitalizes on this growth, in which online and face-to-face components are combined together in the same course of study (Norberg, Dziuban, & Moskal, 2011). The potential to reduce didactic lecture time within the classroom (Aycock, Garnham, & Kaleta, 2002; Dziuban, Hartman, & Moskal, 2004) in favor of interactive teaching and learning gave birth to the “flipped model” of learning where the delivery of content occurs in the student’s home (Lage, Platt, & Treglia, 2000; Hamdan, McKnight, McKnight, & Arfstrom, 2013; Day & Foley, 2006). While any type of instructional material can be utilized in these instructional models, videos are an increasingly popular device for content dissemination (New Media Consortium, 2014; Wu & Yamanaka, 2013). Further, online and interactive electronic college texts utilizing embedded videos are increasing in usage (VitalSource, 2014). With this growth of reliance on online educational videos comes a growing need to understand student experiences – positive and negative, so that better online videos can be created and utilized.
The current study adds a valuable tool to the evolving research agenda surrounding online educational videos, characterized by “isolated arenas with individual lecturers working on specific learning resources” (Shephard, 2003), by suggesting a systematic method of inductively assessing common and shared experiences of hundreds of learners to drive continued improvements of this medium and mode of transmission.
A traditional face-to-face seminar training series for pre-service teachers was converted to an online course relying on videos that covered the same material – often using the same guest speakers. The primary purpose of this article is to present the grounded theory method used to assess common and shared experiences of online course and video experiences as expressed by the participants of this course, utilizing their voices to drive the inductive categorization process.
The main research question asked during the process concerned how the learners experienced the online course and videos in terms of technical issues, pacing of content, navigation of the course, length of videos, etc. Such experience, if properly understood as common and shared experiences across the body of over 100 learners rather than enigmatic personal experiences, would then drive updates, alterations, and fixes to future offerings and video productions. Essentially, we needed to ascertain what worked, what went wrong, and what we needed to fix.
The grounded theory approach chosen allowed the participants to drive the study regarding the categorization of their experiences, on their terms, in their words – utilizing a type of data gathering technique used within phenomenological research (Polkinghorne, 1989), another type of qualitative methodology. This is in contrast to research that relies on a priori hypotheses created by the researcher, with control residing in his or her research agenda and personal scope of understanding. Grounded theory methods allowed the researcher to “listen to” the experiences of the participants as expressed freely without constraining prompts. The result of such methods, however, led to the collection of voluminous and nuanced responses from 116 participants who submitted 325 unique responses comprising over 12,000 words. This sheer volume of nuanced data called for an analysis method that would allow for the interpretation and conversion of individual experiences into a high-level understanding of shared and common experiences. A mixed qualitative-quantitative method of converting numerous qualitative constructed responses into quantifiable data was employed to arrive at higher-level quantitative data, allowing an overall measurement of the subjective experiences of hundreds of participants. This method is unique to the current body of grounded theory research.
Research into the experiences of learners with online videos can draw from classical research into the use of classroom-based films that found, for instance, that learners do not like long sessions of films presented without significant breaks between showings (Ash, 1950). Learner reactions to televised military training films were researched by Kanner, Runyon, and Desiderato (1954) utilizing Yes-No and several fill-in items regarding specific aspects of the videos, such as the speed of the instructor, whether the learner became bored at the end of the instruction, and the desire for more close-up shots. The purpose of that survey was the same as in the current study here: to ascertain areas needing improvement for use “in planning succeeding instructional presentations” (p. 16), but, unlike the current study, it relied on a priori items to ascertain specific attributes of the films.
Recent investigations into learner experiences with online videos show that learners are enthusiastic about online videos (Veeramani & Bradley, 2008; Woo et al., 2008; see Shephard, 2003 for a summary of case studies from 2002), and prefer videos to academic text (Chan, 2010), especially when the former include human elements and a sense of humor (Hibbert, 2014). Videos, however, should be integrated into a blended learning system rather than outright replacing existing material (Mitra, Lewin-Jones, Barrett, & Williamson, 2010). Learners prefer that videos augment, not replace, face-to-face lectures (Cooke et al., 2012; Dey, Burn, & Gerdes, 2009) as their main use of videos is for review: preparing for assessments, reviewing topics, and so on (Cooke, et al., 2012; Dey, 2008). While there is a need to determine the “quality of experience” in the use of educational videos (Ljubojevic, Vaskovic, Stankovic, & Vaskovic, 2014), research is lacking regarding the subjective impacts of online videos as measured by grounded theory techniques to inductively ascertain learners’ naïve descriptions (Polkinghorne, 1989). Such techniques allow students to fully explain the breadth of their experiences, without the objective constraints placed on their descriptions as is typically found in multiple-choice and Likert-type scale items.
Drawing from phenomenological research methods, the researcher utilized the participants’ constructed responses to three items (discussed below), thus gathering what Polkinghorne (1989) describes as “the original naive [sic] descriptions of an experience” (p. 47). To analyze the vast amount of data collected, the researcher then turned to grounded theory inquiry which also seeks to understand the experiences of participants without imposing a priori theories and assumptions regarding what the participants may have experienced (Lincoln & Guba, 1985). Such methods were able to thereby generate holistic theories of behaviors, phenomena, experiences, and so on. This form of qualitative inquiry allows for multiple realities as determined by the participants to “bubble up” from their experiences, interpretations, and impressions in what is termed as naturalistic inquiry (Lincoln & Guba, 1985; Merriam, 2009). The techniques of open coding, constant comparison, and axial coding (Glaser & Strauss, 1967) informed the process in the examination of the nuanced, detailed, and thematic meanings. The researcher further incorporated Charmaz’s (2012) constructivist grounded theory techniques to codify and categorize the data, with influence from Thomas’s (2006) discussion of the use of induction to inform the process.
The method of “content analysis” provided a supplemental theoretical paradigm, which, according to Krippendorf (2013), “is a research technique for making replicable and valid inferences from texts…to the contexts of their use” (p. 24; emphasis original). While content analysis emphasizes an examination of extant text (such as determining the authenticity of historical texts) rather than hundreds of responses to a survey, it is a useful paradigm in that it allows for both quantitative and qualitative methods (Krippendorf [2013, p. 88] criticizes the distinction of quantitative and qualitative methods given that all text is qualitative; see Altheide, 1987). Similarly, Gedik, Kiraz, and Özden (2012) employed phenomenological methods to determine affordances and challenges of blended learning, but involved only ten participants.
Gedik et al. (2012), Polkinghorne (1989), and Creswell (1998) highlight a shortcoming of the above methods: the tendency to focus on fewer participants while producing richer descriptions of experiences – fewer but thicker descriptions (Merriam, 2009). The sheer volume of responses received in this study deviated from the normal methods of phenomenological and grounded theory analysis. In response, the researcher developed an eight-step process he termed “Converting Multiple Constructed Responses to Quantitative Data Process,” or CMCR process. It is predicated upon the following assumptions, thereby limiting its usefulness while maximizing its intended utility:
The CMCR process is similar to quantitative content analysis (QCA) in seeking to count the number of mentions of terms and ideas within the researched content, “especially the frequency and variety of messages, the number of times a certain phrase or speech pattern is used” (Merriam, 2009, p. 205). Where the CMCR process differs with QCA, however, is the instrument and order of sub-processes: the instrument in the QCA process is the survey instrument, documents, transcripts, and so on, whereas the instrument in the CMCR process is the researcher who inductively interprets the participants’ constructed responses, writings, and so on; QCA begins with the examination of a particular phrase or category and moves to “sampling, data collection, data analysis and interpretation” (Altheide, 1987, p. 68), with the consequence of forcing narrative data into predefined categories (Altheide, 1987). Conversely, the CMCR process begins with the participants, turns to an inductive analysis of the data (open coding for topics, creation of categories, and tallying of the categories), and finally to the creation of superordinate categories to determine overall participant experiences. This makes the CMCR process inductive and naturalistic as opposed to QCA’s deductive and imposed nature.
Altheide (1987) developed a qualitative counterpart to the quantitative methods that bears noting at this point: ethnographic content analysis (ECA). This analysis relies on reflexive qualitative coding processes as utilized in grounded theory methods to ascertain “emergent patterns, emphases and themes” of ethnographic phenomena (p. 65). It is applicable to a large number of participants or texts (Altheide, 1987), making it a good reference for the CMCR process. Yet ECA tends to focus on “situations, settings, styles, images, meanings, and nuances” that are recognizable by the participants (Krippendorf, 2013, p. 23), rather than the meanings and interpretations of experiences of those who create the texts. Further, ECA uses “categories and ‘variables’ [to] initially guide the study” (Altheide, 1987, p. 68), making it less naturalistic and inductive than CMCR. The purpose of the present study was to allow the participants’ responses to drive the direction of the categories rather than imposing categories upon the data.
The online course in this study (entitled “College of Education Internship”) addressed professional and practical considerations related to the pre-service teacher internship program in which the participants were enrolled. This internship program was required by state law to occur prior to applying for state licensure. Pre-service teachers, also referred to hereafter as interns, were placed into various public school classrooms to initially work with veteran teachers and eventually assume full control of the classroom and students. Many aspects of such practical, hands-on experience are not covered in the degree program’s curriculum, so are taught to the interns during their internship. This instruction traditionally occurred during various mandatory seminar sessions offered throughout each internship period, ranging from eight-hour days on the university campus to half-day sessions located in the public schools. Such seminars were converted to 30 videos delivered through the university’s online learning management system (LMS), Blackboard Learn. Topics covered encompassed working with parent volunteers, teacher liability issues, student data confidentiality laws, avoidance of infectious diseases and injuries, state school law, applying and interviewing for public school employment, and ethics. Video formats included classroom lecture capture featuring both the computer presentation and speaker on separate video feeds, narrated computer screen capture, dramatized tutoring situations, and live footage of presenters shot indoors and outdoors. Both the researcher and the director of the internship program created and edited all videos, but did not possess formal training in the particulars of directing, videography, or editing. All 202 interns registered for the internship program, at a large Western U.S. university, were automatically enrolled in the online course: 104 in the Fall 2012 term (20 living more than 50 miles from campus – classified as out-of-area) and 98 in the following Spring 2013 term (16 out-of-area). Other demographic data were not collected in this study.
A voluntary anonymous survey comprising three constructed response items and a multiple-choice item regarding desired video length (detailed below) was provided at the end of the course, available through the LMS. For the three constructed response items, 58 interns chose to participate in the Fall term and 64 chose to participate in the Spring term, a total of 122 participants for a 60.4% participation rate (some participants did not respond to all three items). For the multiple-choice item regarding desired video length, 145 chose to participate, 68 in the Fall term and 77 in the Spring term, for a 71.8% participation rate.
No benefits were offered for participation in the survey. The participants were allowed to type as many words as desired in their response to the first three items (“WebCampus” is the university-branded LMS, Blackboard Learn):
A fourth survey item asked the participants to choose their preferred length of videos: “I think the length of the videos should be:” with the following multiple-choice responses:
1 – 4 minutes
5 – 10 minutes
11 – 14 minutes
15 – 20 minutes
20 minutes or more
The steps below describe the process created, worded in the imperative form for those wishing to use or adapt the process.
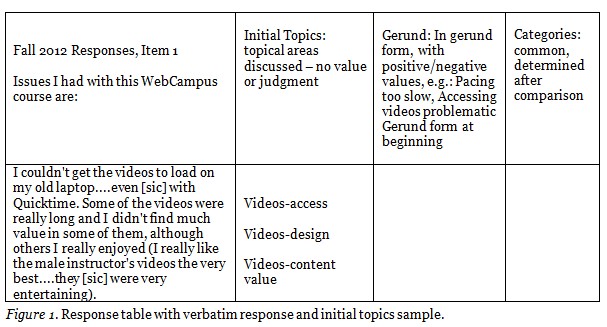
1. Table. Place the responses into a four-column table (illustrated below in Figure 1); an entire response fills one cell (no division of data units as this would confuse the separation of participants).
2. Initial Topics. Ascertain through open coding the initial topics of the responses (e.g., “video access”). No inclusion of value words such as “problematic,” “easy,” “difficult,” and “frustrating.” Because participants share the same phenomenon, constantly compare each participant’s data to the data from other participants. Make adjustments to earlier categories as new data suggest.
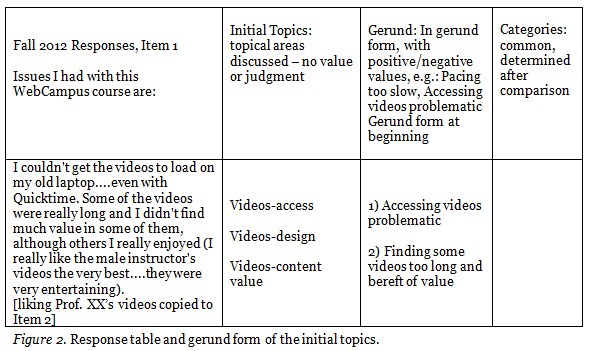
3. Gerund with Value Words. Convert the initial topics into gerund form (___ing) and add value words (e.g., “accessing videos problematic”).
4. Categories. Inductively create categories by comparing the initial topics and gerund forms to each other (e.g., “videos inaccessible”). As in Step 2, constantly compare each category to the participants’ data and to the other categorical names, modifying wording as the data suggest. Then, deductively assess the “fit” of the categories by working in reverse, i.e., could the category label “Videos inaccessible” logically include the Initial Topics that currently comprise it? Modify category labels and included Initial Topics as needed.
5. Tally. Tally up the number of times each category was mentioned by the participants (referred to as “mentions”); each mention is counted only in terms of how many participants mentioned a topic – not in terms of how many times each participant mentioned the topic for that survey item.
6. Repeat. Repeat for each survey item, if applicable.
7. Record in Spreadsheet. Create a spreadsheet to record the categories and number of times each was mentioned, organizing the categories into similar and related groups.
8. Superordinate Categories. Create superordinate categories encompassing semantically and experientially related categories, providing an overall picture of common and shared experiences.
Throughout the process, keep extensive notes on coding decisions, definitions, struggles, and procedures. The researcher used a spiral-bound notebook, encompassing about 40 pages of notes.
Details of the CMCR process are provided below, with an example provided to illustrate the process in action (data from the current study).
1) Response table. Participant responses are copied and pasted into a table comprising four columns: “Responses,” “Initial Topics,” “Gerund,” and “Categories,” with the requisite number of rows corresponding to the number of participants. The verbatim text of the responses is placed in the “Responses” column, one participant per cell. Data are not divided into data units; instead they are left whole per participant so as to not confuse the tallying process to be undertaken in Step 5.
2) Initial topics. Carefully read and initially code each response by identifying the topics suggested by the participant’s words (an inductive approach). Use neutral tones, without any judgmental or value wording. That is, do not include verbiage such as “worthless,” “good,” “slow,” and “poor.” Code each response with the proper number of topics contained therein, such as in Figure 1. Only code a topic once – no matter how many times a participant repeats the same topic. Thus, a long rant about one issue or a long praise about one favorite aspect holds no more weight than a curt description.
Constantly compare labels to those used by previous and subsequent participants, thus adjust “older” labels as necessary, ensuring that the order of responses has negligible influence on the final initial topics’ wording.
Occasionally, a verbatim response may be devoid of contextual meaning, thus rendering the response ambiguous. In such instances, pull up the participant’s responses to other survey items in search of context meaning (e.g., if a participant stated, “As I said above, it was…” examine the participant’s “above” responses from the other survey items to determine the contextual meaning).
3) Gerund. After completing the initial coding for all participants, translate the initial topics into their respective “___ing” forms (the gerund form, see Charmaz, 2012). For example, convert “access” to “accessing” and “pace” to “pacing.” Value and judgmental words are added to the gerund form, such as including the words “problematic,” “bereft of value,” “slow,” and “easy.” Thus, the full meaning of the verbatim response is now seen, such as in Figure 2.
When participants include information relevant to a different survey item, note such information and to which survey item it is transferred (a comment about Prof. XX’s entertaining videos is noted in the example as copied to Item 2, as Item 2 addressed participants’ positive experiences).
4) Categories. Step away from the coding process for a few days before creating the categories, coming back fresh and eager. The categories – located in the far-right column – are created based on the topics listed in the Initial Topics and Gerund columns (with occasional comparison to the verbatim responses, as needed). Constant comparison within the Categories column is employed during the process, similar to Strauss and Corbin’s (1990) axial coding process, in which “data are put back together in new ways after open coding by making connections between categories” (p. 96). Figure 3 shows three categories emerging from the sample data.
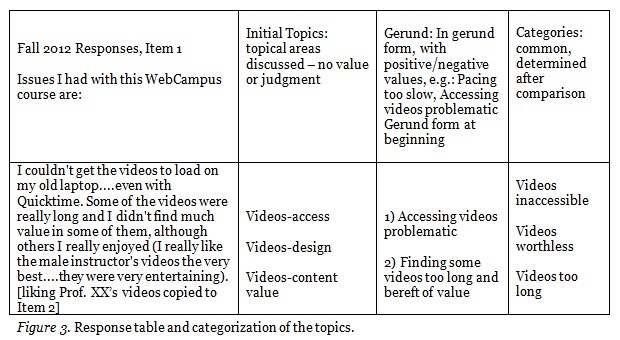
The creation of categories involves both inductive and deductive processes. In the inductive process, the data from the verbatim Response, Initial Topics, and Gerund columns informs the creation of the categories; that is, the categories emerge from the data. The deductive process occurs by judging whether some Initial Topics really fit into the Categories by formulating what types of ideas and topics would fit each Category, and then “trying out” the Initial Topics to determine if they do, indeed, feel like a good fit. For instance, a category called “Accessing the course convenient” was first created because several participants indicated their appreciation of being able to access the course online, in the evenings after work. As the researcher read subsequent participant responses and topics, he found participants who mentioned that they did not have to drive to campus to complete the online course. He thought back to the category “Accessing the course convenient” and made deductive assumptions as to the type of topics that this category could contain. While the category initially referred to a convenience of time schedules, he determined that the category could also contain conveniences related to geography and travel burdens: each type of convenience was, in fact, a convenience created because the course was online. He therefore included the geographic and travel-related convenience within this category rather than create a new one specific to geography and travel.
5) Tally. Once the categories are listed in the Category column, create a simple Tally Table to record the categories and the number of mentions each received – organization and order are not yet important.
6) Repeat. Repeat stages 1) through 5) for other survey items, if applicable.
7) Record in spreadsheet. Create a spreadsheet to record the tallies from the Tally Table, organizing the categories into similar groupings that best encompass the commonalities of related categories, as seen in Figure 4. For instance, the categories “Videos inaccessible,” “External links broken,” and “Problems accessing WebCampus” related to the same meta-concept of technical problems, whereas other categories, such as “Videos worthless” and “Videos too long,” referenced non-technical meta-concepts such as the perceived worth of the videos. Such categories were organized together in a second group.
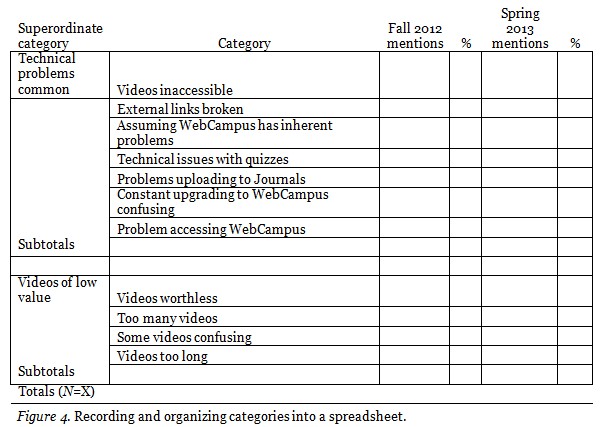
8) Superordinate categories. The grouping process in Stage 7) highlights meta-themes and commonalities found between semantically and experientially related categories. This allows for the inductive creation of superordinate categories – providing a high-level overview, and a better grasp on the overall experience of a common phenomenon. Figure 4 shows two superordinate categories, “Technical problems common,” and “Videos of low value.”
The CMCR process revealed 440 initial topics for the survey items, in 78 categories, combined into 18 superordinate categories (including Misc), listed in Tables 1 through 3.
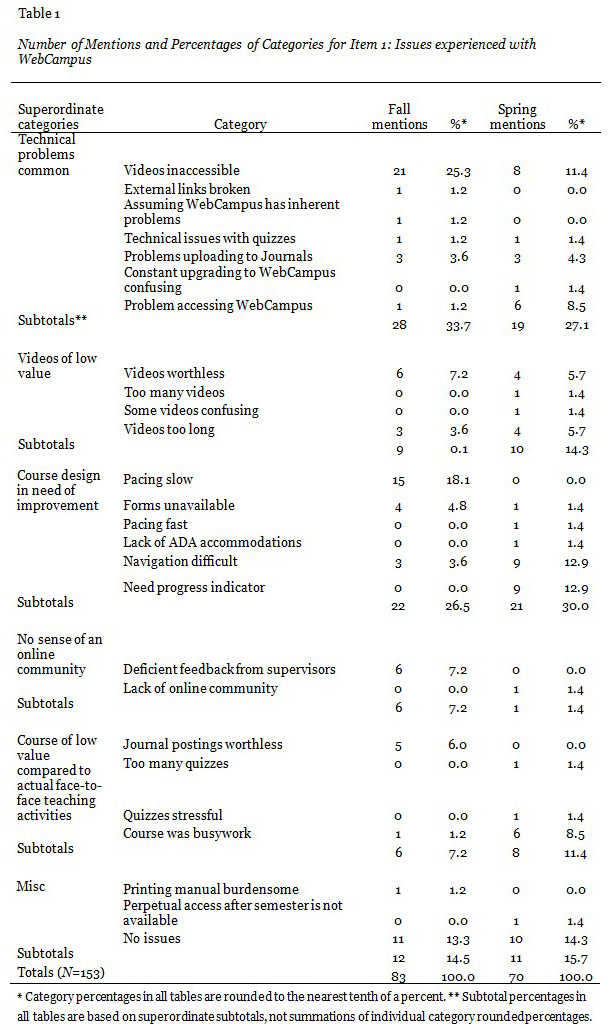
Item 1 asked the participants to discuss problems they experienced. One-hundred-and-sixteen participants (Fall N=58, Spring N=58) submitted responses. Twenty-one (18.1%) indicated that they experienced no issues or problems. The remaining participants indicated that they experienced issues and problems expressed in six superordinate categories, seen in Table 1. Technical problems dominated the participants’ experiences (with inaccessible videos a common problem), followed by dissatisfaction with the course structure (namely the slow pacing of the course for Fall).
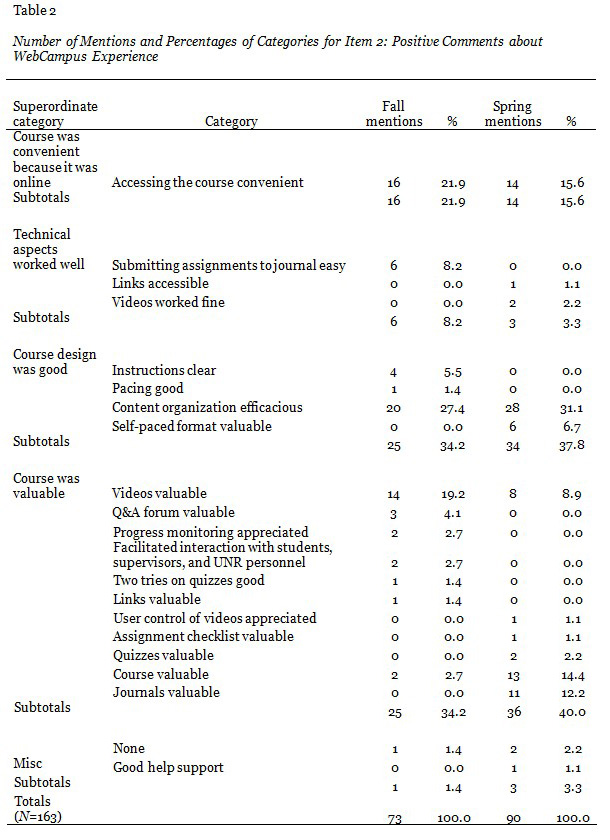
Item 2 asked participants to discuss their positive experiences. One-hundred-and-nine participants (Fall N=45, Spring N=64) submitted responses. Three (2.8%) indicated that they had nothing positive to say. The remaining participants indicated that they were exposed to various positive experiences, expressed in five superordinate categories shown in Table 2. Pleasing course design and perceived value of the course tied at the top of the list (with efficacious content organization and valuable videos driving these superordinate categories), followed by the convenience of the online format.
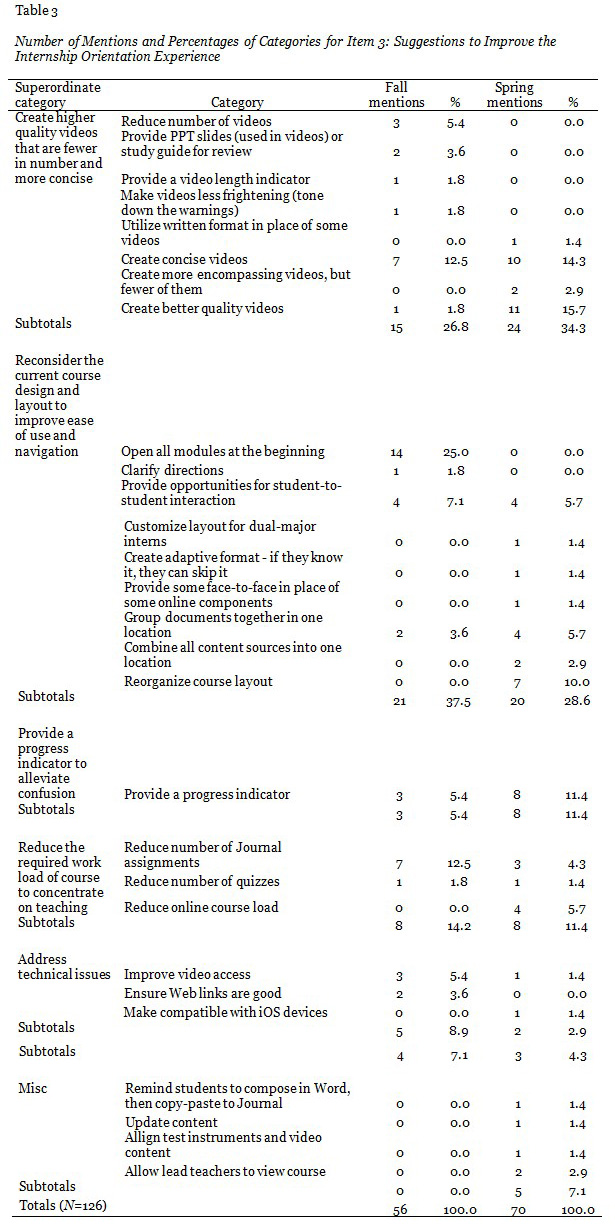
Item 3 asked participants to suggest improvements. One-hundred participants (Fall N=39, Spring N=61) submitted responses. The participants suggested a variety of improvements as expressed in seven superordinate categories, seen in Table 3. The most common suggestion was to improve the course design (comprised mainly of the suggestion to open all modules at the beginning, that is, to allow for self-pacing), followed by the suggestion to improve the quality of the videos while making fewer of them. These suggestions were taken into consideration between semesters by opening all modules at the beginning for the Spring 2013 semester and condensing several videos (10% of the total video offerings).
It is interesting to note that after the change to a self-paced format, the Spring participants indicated that they were confused as to where they should be at what point, with the desire for a progress indicator, seen in Table 1 under “Course design in need of improvement,” and Table 3 under “Reconsider the current course design…” and “Provide a progress indicator…” While qualitative research does not seek to establish causality, logic would suggest that the conversion of the online course into a self-paced format likely brought about such confusion and need for progress indication.
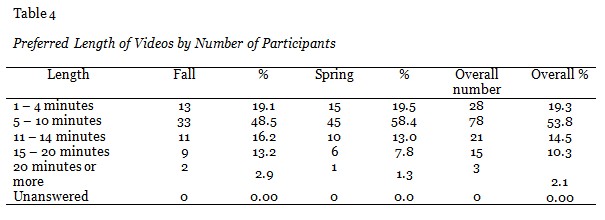
In the multiple-choice survey item regarding participants’ preferred length of videos, of the 145 participants (Fall N=68, Spring N=77) 53.8% preferred videos to be between five and ten minutes in length, and an additional 19.3% preferred shorter videos, seen in Table 4. Overall, 73.1% of participants preferred educational videos to be under ten minutes in length.
The increasing reliance on online education and videos within all levels of education calls for an increasing understanding of the experiences of learners in order to ascertain areas in need of improvement and adjustment, from technical to artistic issues. Given the vast number of learners, breadth of experiences, and complex nuances of language used by learners to describe their experiences, a method to, in essence, distill the common shared experiences of learners is needed. Such a method is best situated within phenomenological and grounded theory inquiries that allows the learners to drive the categorization of their experiences, rather than relying on the a priori hypotheses and research questions crafted by researchers who must assume what types of experiences online learners may have, and then measure accordingly.
This study collected experiential data from 116 participants who shared their myriad of positive and negative experiences using over 12,000 words. An inductive coding process drawing from the constructivist grounded theory methods proposed by Charmaz (2012) and ethnographic content analysis by Altheide (1987) was created: Converting Multiple Constructed Response Items to Quantitative Data (CMCR). This eight-step process revealed 18 superordinate categories of experience, comprising 78 “sub” categories. Many of the issues (both positive and negative) were of surprise to the researcher and the seminar director, driving improvements to the course and videos.
While we expected that the participants would appreciate the flexibility offered by the online course and videos – in terms of scheduling and coming to campus, we did not anticipate other findings. Thus, a study that relied on a priori categories may have missed such important common and shared experiences. The main findings were:
First, many participants noted a serious issue regarding technical access to the videos. The issues ranged from audio-video synching and truncated playback, to the complete inability to access some videos. Much of the problem centered on the university’s video hosting system. It was designed to serve up videos without any codec or bit rate conversion – that is, the exact file that was placed on it was the exact file that was streamed to the participants. For instance, we created large video files utilizing the .MOV shell with the H.264 codec inside, which is exactly the same file as was served up to the participants – no matter their devices, video viewers, or Internet connection speeds. This is the opposite operation in use by popular video hosting services such as YouTube and Vimeo, in that they convert uploaded videos into the proper codec and bit rate as to be most compatible with the end user’s device and Internet connection speed. The feedback received in this study influenced the university to purchase a corporate video hosting solution that offered such conversions (it went online in late 2013).
Second, the participants desired concise videos that also displayed better production quality. Many of the videos were over 20 minutes in length, whereas almost three-fourths of the participants indicated that they preferred the videos be less than ten minutes. One limitation to this survey item is that it made no differentiation between video content and artistic format (e.g., documentary, talking-head, dramatized), nor between situational contexts where the participants watched the videos (e.g., in their living room, at a coffee shop, at work during a break, on a bus). Such factors may influence learner preferences and should be taken into account in future research. A second limiting factor to these findings concerns why the participants prefer shorter videos (e.g., they can only consume short videos while on a work break, possess short attention spans, tire easily when watching “boring” material, have a lack of motivation). Qualitative inquiry would likely help elucidate such reasons and provide suggested prescriptive video design. This vein of research holds implications for the field of distance education, discussed below.
We learned that video production is a much more involved process than we anticipated and that proper planning, production, and hosting of videos require more demanding technical skills and pedagogical understanding than we then possessed.
Third, while one of the purposes of the conversion was to eliminate the burden of face-to-face seminars endured by the internship staff and director, the participants also greatly appreciated the flexibility in scheduling content consumption around their busy lives, while not having to come to campus.
Fourth, self-paced online courses, where there is a minimal amount of continuous student-instructor contact (as was the case in this course), can be confusing for students, requiring some type of progress indicator to help them know what to do when, in what order, and what they still have yet to do.
The process created for this study, the CMCR process, may be a valuable tool for those researchers looking to collect the subjective, freely given responses from hundreds of participants who experienced the same phenomenon, to inductively ascertain common, shared experiences and interpretations thereof. Such a process helps attain a high-level understanding that is difficult to grasp given the many nuances, phrasing, and terminology such a vast data collection process will produce. Such a technique is applicable for a broad range of applications, including corporate education, online K-12 schools, and health care education.
Limitations of this study include the lack of demographic data collected for participants, including computer abilities and self-efficacy data. While this study employed the Technology and Internet Assessment (TIA) survey instrument (Ealy, 2000) to ascertain the latter data, the researcher was not able to connect participant data from the TIA survey to those data collected in the experiential, constructed response survey. Examination of the 45 TIA survey participants (22.2% participation rate) revealed above-average computer and Internet abilities and self-efficacy perceptions compared to nationally normed data. It is only possible, however, to make speculative inference that the TIA data may be representative of those who participated in the experiential survey, thus such data are not reported above.
Other limits include the context in which these data were collected: an authentic learning environment encompassing multiple locations around the Western United States. Such authenticity enhances external validity, but makes it more difficult for the researcher to account for confounding variables, such as type of computer equipment used by the participants, Internet service provider speed and reliability, time-of-day impacts, home environment variables, and so on. Learner control of multimedia can increase learning outcomes (Mayer & Chandler, 2001), but such data were not available through the video hosting system in use during the study. Future research should look at collecting more specific data regarding such confounding variables, as well as learner control of videos: pausing, rewinding, and re-watching behaviors. Such a study, of course, would employ quantitative methodologies rather than qualitative methodologies as used in the present study.
The current study exhibited several video design and access concerns that were unique to the institution. Thus, these findings may vary if a different video-hosting service was used. The impetus for this study was to ascertain such issues, many of which were corrected for future iterations.
Three main implications for the field of distributed education research emerged from this study: the production quality of videos may directly and indirectly impact learning outcomes, preferred length of videos may impact learning outcomes, and there may be optimal or preferred content areas to be presented with the video medium.
Direct impacts of video production quality may result because of interference in the message causing confusion or incomprehensibility, distortion, or inaudible sound/non-viewable visuals. Indirect impacts include the possibility that low quality compared to expected quality may lower viewer interest and attention, or subconsciously devalue the information presented in the video (e.g., if the video was not worth spending considerable effort to create, the content must not be worth much, either). Further, incomprehensibility of content lowers viewer attention (Anderson, Lorch, Field, & Sanders, 1981), thus likely leading to decreased encoding of content.
The preferred length of videos may fall under a discussion of viewer attention spans. While a full discussion of the field of vigilance decrement theory (Parasuraman, 1986; Johnstone & Percival, 1976; Smith, 2006) and its applicability to pedagogical design (Young, Robinson & Alberts, 2009) is outside the scope of this paper, it is certainly a concept in need of fuller study. Classical research conducted during World War II regarding the impact of massed presentations (longer sessions) versus spaced presentations (sessions separated by breaks) offers guidance (e.g., Hoban, 1946; Ash, 1950), however, the educational contexts studied were very different than today’s online situations that afford private viewing and learner control. More recent research into the concept of segmentation of multimedia modules as found in Mayer’s work (e.g., Mayer & Chandler, 2001; Mayer, Dow, & Mayer, 2003) are also informative, bearing in mind that segmentation in this sense is limited to videos lasting only seconds – impractical lengths in real-world educational settings. Ibrahim, Antonenko, Greenwood, and Wheeler (2012) offer support in favor of videos about six minutes in length versus 32 minutes, but confounding variables obscured the clarity of the treatments on the study’s results. Thus the researcher strongly believes that further clarification of the impacts of video length – to include comparisons of massed versus spaced videos – be re-examined in light of online, private, and learner-controlled access factors.
Finally, it is also suggested that, based upon some participants’ comments, future research examine the type of video content preferred by learners in terms of learning effectiveness. Research regarding content areas involving process or procedural content versus factual or abstract knowledge should be conducted – as some content may best be left to text. Classical media comparison studies examined this topic in terms of comparing film to other forms of delivery modes (e.g., Wood & Freeman, 1929; Wise, 1939; Hall & Cushing, 1947; Kanner, Runyon, & Desiderato, 1954), offering starting points for future research.
Allen, I. E., & Seaman, J. (2007). Online nation: Five years of growth in online learning. Retrieved from http://www.sloanconsortium.org/publications/survey/pdf/online_nation.pdf
Allen, I. E., & Seaman, J. (2013). Changing course: Ten years of tracking online education in the United States. Retrieved from http://sloanconsortium.org/publications/survey/changing_course_2012
Altheide, D. L. (1987). Ethnographic content analysis. Qualitative Sociology, 10(1), 65-77.
Anderson, D. R., Lorch, E. P., Field, D. E., & Sanders, J. (1981). The effects of TV program comprehensibility on preschool children’s visual attention to television. Child Development, 51(1), 151-157.
Ash, P. (1950). The relative effectiveness of massed versus spaced film presentation. Journal of Educational Psychology, 41(1), 19-30.
Aycock, A., Garnham, C., & Kaleta, R. Lessons learning from the hybrid course project. Teaching with Technology Today, 8(6). Retrieved from http://www.uwsa.edu/ttt/articles/garnham2.htm
Chan, Y. M. (2010). Video instructions as support for beyond classroom learning. Procedia Social and Behavioral Sciences, 9, 1313-1318.
Charmaz, K. (2012). The power and potential of grounded theory. Medical Sociology Online, 6(3), 2-15.
Cooke, M., Watson, B., Blacklock, E., Mansah, M., Howard, M., Johnston, A., Tower, M., & Murfield, J. (2012). Lecture capture: First year student nurses’ experiences of a web based lecture technology. Australian Journal of Advanced Nursing, 29(3), 14-21.
Cresswell, J. W. (1998). Qualitative inquiry and research design: Choosing among five traditions. Thousand Oaks, CA: SAGE Publications.
Day, J., & Foley, J. (2006, April). Evaluating Web lectures: A case study from HCI. Proceedings from the Association for Computing Machinery conference on Computer Human Interaction ’06: Proceeding of 2006 Conference on Human Factors in Computing Systems. New York: ACM Available from http://portal.acm.org/citation.cfm?id=1125493
Dey, E. L. (2008). A variety of diversity: Facing higher education’s educational challenges. Proceedings from American Institute of Physics Conference 2008: AIP Conference Proceedings, 1064(1), 1-14.
Dey, E. L., Burn, H. E., & Gerdes, D. (2009). Bringing the classroom to the Web: Effects of using new technologies to capture and deliver lectures. Research in Higher Education, 50(4), 377-393.
Dziuban, C. D., Hartmtan, J. L., & Moskal, P. D. (March 30, 2004). Blended learning. Research Bulletin, 7. Retrieved from http://net.educause.edu/ir/library/pdf/erb0407.pdf
Ealy, M. (2000). Technology and Internet assessment. Clearwater, FL: H&H Publishing Company.
Gedik, N., Kiraz, E., & Özden, M. Y. (2012). The optimum blend: Affordances and challenges of blended learning for students. Turkish Online Journal of Qualitative Inquiry, 3(3), 102-117.
Glaser, B. G., & Strauss, A. L. (1967). The discovery of grounded theory: Strategies for qualitative research. Hawthorne, NY: Aldenie de Gruyter.
Hall, W. E., Cushing, J. R. (1947). The relative value of three methods of presenting learning material. The Journal of Psychology: Interdisciplinary and Applied, 24(1), 57-62.
Hamdan, N., McKnight, P., McKnight, K., & Arfstrom, K. M. (2013). A review of flipped learning. Retrieved from http://flippedlearning.org/Page/64
Hibbert, M. (2014, April 7). What makes an online instructional video compelling? Retrieved from http://www.educause.edu/ero/article/what-makes-online-instructional-video-compelling?utm_source=Informz&utm_medium=Email+marketing&utm_campaign=EDUCAUSE
Hoban, C. F. (1946). Movies that teach. New York: The Dryden Press, Inc.
Ibrahim, M., Antonenk, P. D., Greenwood, C. M., & Wheeler, D. (2012). Effects of segmenting, signaling, and weeding on learning from educational video. Learning, Media and Technology, 37(3), 220-235.
Johnston, A. H., & Percival, D. F. (1976). Attention breaks in lectures. Education in chemistry, 13(2), 49-50.
Kanner, J. H., Runyon, R. P., & Desiderato, O. (1954). Television in army training: Evaluation of television in army basic training. Washington, D.C.: The George Washington University.
Krippendorf, K. (2013). Content analysis: An introduction to its methodology (3rd ed.). Thousand Oaks, CA: SAGE Publications.
Lage, M. J., Platt, G. J., & Treglia, M. (2000). Inverting the classroom: A gateway to creating an inclusive learning environment. Journal of Economic Education, 31(1), 30-43.
Lincoln, Y. S., & Guba, E. G. (1985). Naturalistic inquiry. Newbury Park, CA: Sage.
Ljubojevic, M., Vaskovic, V., Stankovic, S., & Vaskovic, J. (2014). Using supplementary video in multimedia instruction as a teaching tool to increase efficiency of learning and quality of experience. The International Review of Research in Open and Distance Learning, 15(3). Retrieved from http://www.irrodl.org/index.php/irrodl/article/view/1825
Mayer, R. E., Chandler, P. (2001). When learning is just a click away: Does simple user interaction foster deeper understanding of multimedia messages? Journal of Educational Psychology, 93(2), 390-397.
Mayer, R. E., Dow, G. T., & Mayer, S. (2003). Multimedia learning in an interactive self-explaining environment: What works in the design of agent-based microworlds? Journal of Educational Psychology, 95(4), 806-813.
Merriam, S. B. (2009). Qualitative research: A guide to design and implementation. San Francisco: Jossey-Bass.
Mitra, B., Lewin-Jones, J., Barrett, H., & Williamson, S. (2010). The use of video to enable deep learning. Research in Post-Compulsory Education, 15(4), 405-414.
New Media Consortium. (2014). The NMC horizon report: 2014 higher education edition. Retrieved from http://www.nmc.org/publications/2014-horizon-report-higher-ed
Norberg, A., Dziuban, C. D., & Moskal, P. D. (2011). A time-based blended learning model. On the Horizon, 19(3), 207-216.
Parasuraman, R. (1986). Vigilance, monitoring, and search. In K. R. Boff, L. Kaufman, & J. P. Thomas (Eds.), Handbook of perception and human performance (Vol. 2) (43:1 – 43:39). New York: John Wiley and Sons.
Picciano, A. G. (2006). Blended learning: Implications for growth and access. Retrieved from http://sloanconsortium.org/jaln/v10n3/blended-learning-implications-growth-and-access
Polkinghorne, D. E. (1989). Phenomenological research methods. In R. S. Valle & S. Halling (Eds.), Existential-phenomenological perspectives in psychology (pp. 41-60). New York: Plenum Press.
Shephard, K. (2003). Questioning, promoting and evaluating the use of streaming video to support student learning. British Journal of Educational Technology, 34(2), 295-308.
Smith, D. K. (2006). Use of the mid-lecture break in chemistry teaching: A survey and some suggestions. Journal of Chemical Education, 83(11), 1621-1624.
Strauss, A., & Corbin, J. (1990). Basics of qualitative research. Newburry Park, CA: SAGE Publications.
Thomas, D. R. (2006). A general inductive approach for analyzing qualitative evaluation data. American Journal of Evaluation, 27(2), 237-246. doi: 10.1177/1098214005283748
VitalSource. (2014). Fourth annual Wakefield survey cites cost of college, technology innovation as top trends in higher education. Retrieved from http://www.vitalsource.com/pressreleases/Pages/Fourth-Annual-Wakefield-Survey-Cites-Cost-of-College-Technology-Innovation-as-Top-Trends-in-Higher-Education.aspx
Veeramani, R., & Bradley, S. (2008). UW-Madison online-learning study: Insights regarding undergraduate preference for lecture capture. University of Wisconsin-Madison: E-Business institute. Available from http://www.scribd.com/doc/59751474/UW-Online-Learning-Study-1#archive
Wise, H. (1939). Motion pictures as an aid in teaching American history in the senior high school. New Haven, CT: Yale University Press.
Woo, K., Gosper, M., McNeill, M., Preston, G., Green, D., & Phillips, R. (2008). Web-based lecture technologies: Blurring the boundaries between face-to-face and distance learning. ALT-J, Research in Learning Technology, 16(2), 81–93.
Wood, B., & Freeman, F. (1929). Motion pictures in the classroom. Boston: Houghton Mifflin.
Wu, L. Y., & Yamanaka, A. (2013). Exploring the effects of multimedia learning on pre-service teachers’ perceived and actual learning performance: The use of embedded summarized texts in educational media. Educational Media International, 59(4), 291-305.
Young, M. S., Robinson, S., & Alberts, P. (2006). Students pay attention! Combating the vigilance decrement to improve learning during lectures. Active Learning in Higher Education, 14(41), 41-55.
© Harrison