
|
Katy Jordan
The Open University, UK
The past two years have seen rapid development of massive open online courses (MOOCs) with the rise of a number of MOOC platforms. The scale of enrolment and participation in the earliest mainstream MOOC courses has garnered a good deal of media attention. However, data about how the enrolment and completion figures have changed since the early courses is not consistently released. This paper seeks to draw together the data that has found its way into the public domain in order to explore factors affecting enrolment and completion. The average MOOC course is found to enroll around 43,000 students, 6.5% of whom complete the course. Enrolment numbers are decreasing over time and are positively correlated with course length. Completion rates are consistent across time, university rank, and total enrolment, but negatively correlated with course length. This study provides a more detailed view of trends in enrolment and completion than was available previously, and a more accurate view of how the MOOC field is developing.
Keywords: MOOCs; higher education; massive open online courses; online education; distance learning
In the past two years, massive open online courses (MOOCs) have entered the mainstream via the establishment of several high-profile MOOC platforms (primarily Coursera, EdX, and Udacity), offering free courses from a range of elite universities and receiving a great deal of media attention (Daniel, 2012). 2012 has been referred to as ‘the year of the MOOC’ (Pappano, 2012; Siemens, 2012), and some herald this as a significant event in shaping the future of higher education, envisioning a future where MOOCs offer full degrees and ‘bricks and mortar’ institutions decline (Thrun, cited in Leckart, 2012).
There are clearly great potential individual and societal benefits to providing university-level education free of some of the traditional barriers to participation in elite education, such as cost and academic background. However, it is not clear the extent to which MOOCs provide these benefits in practice. MOOCs may favour those who are already educationally privileged; Daphne Koller of Coursera has stated that the majority of their students are already educated to at least undergraduate degree level, with 42.8% holding a bachelor’s degree, and a further 36.7% and 5.4% holding master’s and doctoral degrees (Koller & Ng, 2013). A further study of Coursera students enrolled in courses provided by the University of Pennsylvania indicates a greater dominance of highly educated students, 83.0% of respondents being graduates and 44.2% being educated at the postgraduate level (Emanuel, 2012). The author concludes that MOOCs are failing in their goal to reach disadvantaged students who would not ordinarily have access to educational opportunities (Emanuel, 2013). In order to succeed in a MOOC environment, higher digital literacy may be required of students (Yuan & Powell, 2013), potentially exacerbating pre-existing digital divides. In theory MOOCs remove geographical location as a boundary to access, although a lack of internet access may prevent this from being realized in practice (Guzdial, 2013).
Although smallerscale, connectivist MOOCs have existed for several years, the development of largerscale MOOCs offered by elite institutions has propelled MOOCs into the mainstream. The earliest and perhaps most highly cited example is the Stanford AI class, which attracted 160,000 students (20,000 of whom completed the course) when it ran in autumn 2011 (Rodriguez, 2012). However, while this example is often used, it is unlikely to be representative of how the field is developing. A survey undertaken by The Chronicle of Higher Education in February 2013 suggested that the average MOOC enrolment is 33,000 students, with an average of 7.5% completing the course (Kolowich, 2013). Detailed studies of particular courses have emphasized that those who enroll upon courses have a wide variety of motivations for doing so (Breslow et al., 2013; Koller, Ng, Do, & Chen, 2013); however motivation does not predict whether a student will complete a course (Breslow et al., 2013). In examining completion and engagement with courses, studies have focused upon characterizing types of learners (Kizilcec, Piech, & Schneider, 2013; Koller et al., 2013). Limitations of these studies are that they focus upon a small number of early MOOCs, and ascribe course completion primarily to student choice and motivation. There is a gap in the research literature here about what could be learnt about characteristics of courses themselves and their effect upon enrolment and completion, which this study sought to explore.
Six-figure enrolment statistics have generated a good deal of interest in MOOCs in the higher education sector, and are frequently conflated with active participation or completion. However, the earliest courses are the most frequently cited examples and may not be representative of how the phenomenon is developing, and the extent to which enrolment numbers are indicative of completion has not been explored comprehensively. These issues are obscured to an extent by a lack of consistent data being made open to those outside of the MOOC platforms. For example, the Coursera data export policy gives individual institutions control over the data that is released about courses (Coursera, 2012), and in practice the extent of data sharing is highly variable and ad hoc.
Now, over 18 months on from the advent of the large MOOC platforms, this paper seeks to synthesise the data that has found its way into the public domain in order to address some of the very basic questions associated with MOOCs. How massive is ‘massive’ in this context? Completion rates are reputedly low, but how low? From the available data, can we learn anything about factors which might affect enrolment numbers and completion rates?
The approach taken here drew together a variety of different publicly available sources of data online to aggregate information about enrolment and completion for as many MOOCs as possible. Information about enrolment numbers and completion rates were gathered from publicly available sources on the Internet. Given the media attention which MOOCs have garnered, and their ‘massive’ nature, there is a good deal of publicly available information to be found online, including news stories, university reports, conference presentations, and MOOC student bloggers. Issues of reliability associated with using this data are addressed below.
The list of completed MOOCs maintained at Class Central1 was used as a starting point for the inquiry. Completed courses from Coursera, EdX, and Udacity were identified for inclusion in the study, while other individual MOOCs and platforms were excluded. This criteria was used because (i) Coursera, EdX, and Udacity are the platforms which have received the greatest media focus and have fuelled the global interest in MOOCs, (ii) the platforms account for the vast majority of MOOCs to date, and (iii) the platforms reflect the higher education sector more broadly, offering courses presented from ‘bricks and mortar’ institutions through the platforms. At the time of writing (22nd July 2013), this list comprised 279 courses (including courses which have run multiple times).
Enrolment and completion figures were selected as the data to be collected for the courses, as these are the metrics which are most commonly available. Completion in this sense was defined as the percentages of students who had satisfied the courses’ criteria in order to gain a certificate. The exact activities required to achieve this vary according to course. Where possible, data was also recorded about the number of ‘active users’ in courses. Information about the number of active users was available for 33 courses, although some did not provide any definition of the term. Those courses who did define active users characterized them as students who actively engaged with the course material to some extent (as opposed to those who enrolled but did not use the course at all). For example, this includes having logged in to a course, attempted a quiz, or viewed at least one video. Data was also collected about the date a course began, the course length in weeks, and university ranking (using the Times Higher Education World Rankings; THE, 2013) in order to explore whether these factors affect enrolment and completion.
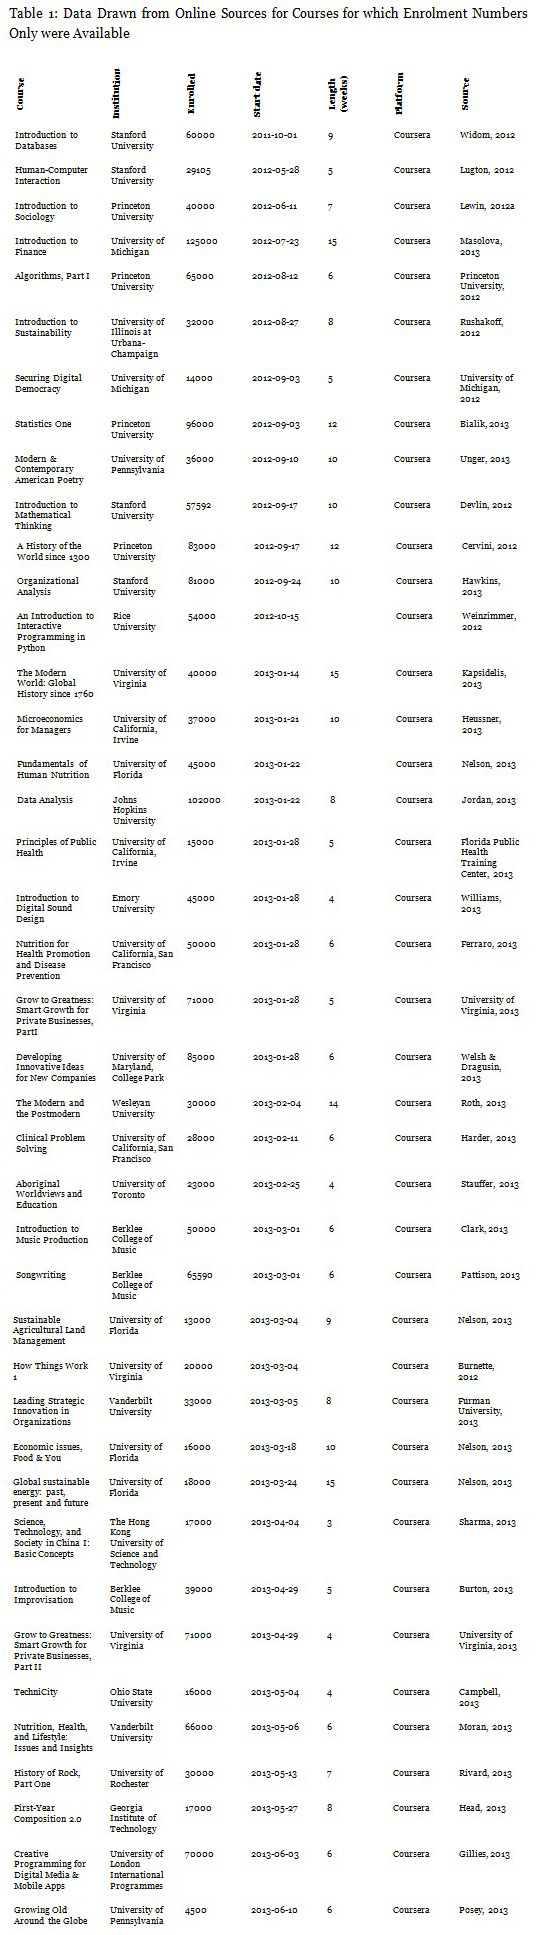
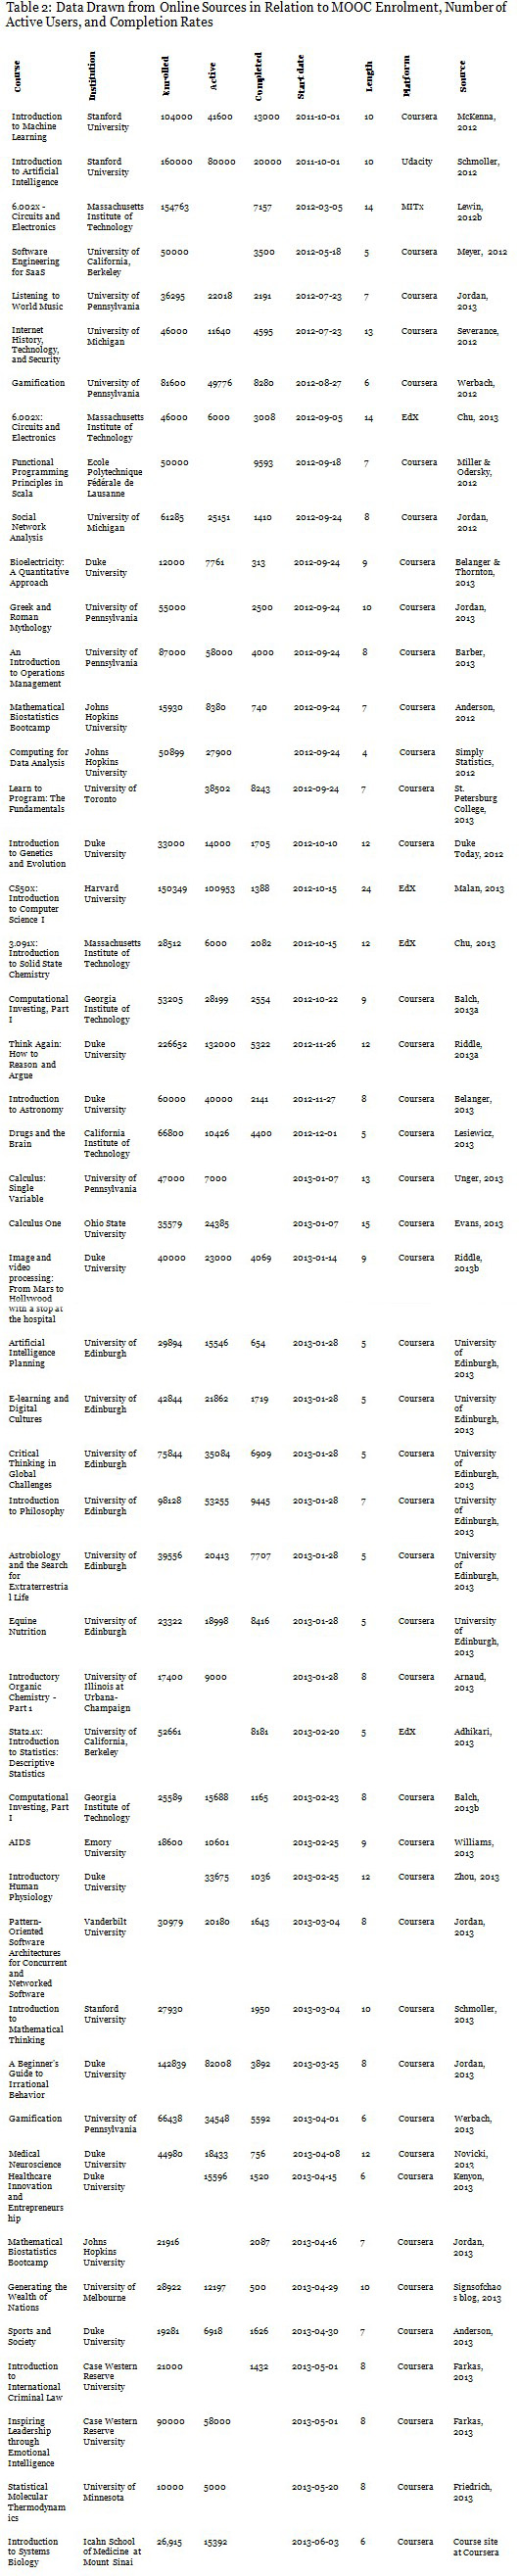
The enrolment and completion data was collected in two ways: via internet searches and crowdsourcing information from students who participated in courses, by appealing via social media. Students contributed data which had been shared with them by the course instructor to the author’s blog (Jordan, 2013). This yielded information about enrolment numbers for a total of 91 courses (32.6% of total potential sample), and completion for 42 courses (15.1% of total). For transparency, the sources used for all data items are included here. Details of courses for which only enrolment data was available are shown in Table 1; details of courses for which completion data was found are shown in Table 2.
Data analysis was conducted using linear regression carried out with Minitab statistical software. Linear regression was chosen as the approach to analysis because at this stage the aim of the research was exploratory, to identify potential trends rather than being explanatory and seeking to fit a model. This would be a valuable goal for follow-up research particularly if more consistent data became available for MOOCs more broadly.
Linear regression analyses were carried out individually according to different factors of interest rather than as a single multiple regression due to issues of data consistency and availability; that is, data is not available for every field in Tables 1 and 2 for every course, so n varies according to different tests (see Results and Analysis section). Rather than discarding courses for which the full spectrum of data was not available and in order to gain the greatest insight possible into the different factors, a series of individual regression analyses were carried out.
There are a number of limitations which must be borne in mind with the approach taken by this study, including issues of validity of data and reliability of the research instruments used.
In terms of validity, it should be noted that the accuracy of figures varies according to sources, with some institutions releasing highly accurate figures and others (particularly when releasing enrolment data through the press) are rounded figures. This reflects the fact that MOOC courses do not consistently release this information into the public domain, and most of the courses that would have been eligible for inclusion (67.4%) have not released any data. Of the institutions or instructors choosing to make data available, bias may be introduced according to their motivations for publicizing this information, which are unknown. There is also a degree of trust involved in the information provided by student informants via the blog.
It should be emphasized that the study sought to be exploratory in nature, identifying trends of interest in the data as a starting point for further research but not seeking to explain or model the phenomenon. Reliability of the approach is less contentious as the data have been collected via several rounds of internet searches during the data collection period (February 13th to July 22nd 2013) and shown in full in Tables 1 and 2 should others wish to reproduce the tests or carry out alternative analyses. By collating data ‘in the open’ at the author’s blog (Jordan, 2013), this offered a platform for others (including course leaders) to scrutinize the data and provide more accurate figures in some cases.
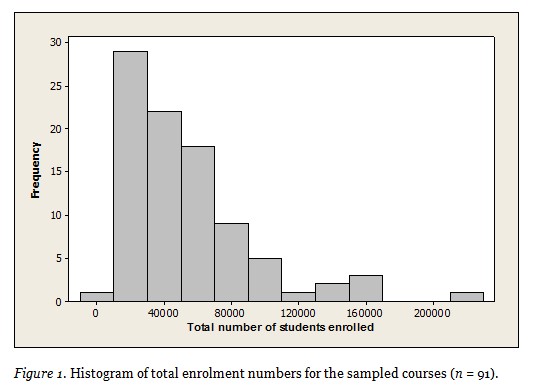
Total enrolment numbers draws upon the data in both Tables 1 and 2, which comprises a total of 91 courses (excluding three courses which are missing total enrolment figures). Total enrolment figures range from 4,500 to 226,652 students, with a median value of 42,844. The data does not exhibit a normal distribution (Figure 1); six-figure enrolments are not representative of the ‘typical’ MOOC. Total enrolments are shown plotted against the date each course began in Figure 2. This demonstrates a negative correlation, with enrolment numbers decreasing over time.
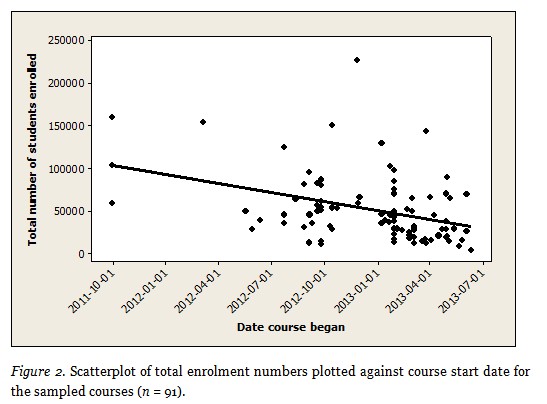
A regression analysis was carried out, prior to which the data was subject to a Box-Cox transformation as the residuals do not follow a normal distribution. Regression analysis showed that date significantly predicted total enrolment figures at the 95% significance level by the following formula: ln(Enrolled) = 104.249 - 0.00226915*StartDate (R2 = 0.1719, p < 0.001). The relationship is a negative correlation, indicating that as time has progressed, enrolment figures have decreased. The relationship is relatively weak (time as a factor accounts for 17.2% of the variance observed, as R2 is a measure of the fraction of variance explained by the model; Grafen & Hails, 2002), although the sample is sufficiently large that this is statistically significant (critical R2 values decrease according to sample size, with an n of 91 being relatively large; Siegel, 2011). This highlights that a focus upon figures from early courses is misleading and not representative of how the field is developing.
The relationship between course length and total enrolments was also considered, and found to demonstrate a positive correlation between course length and total enrolment (Figure 3).
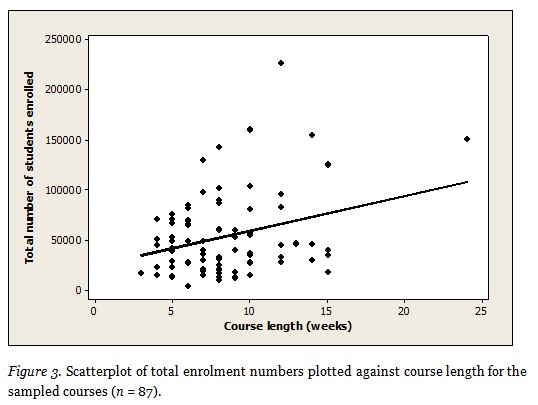
Following a Box-Cox transformation, regression analysis showed that course length significantly predicted (at the 95% significance level) total enrolment figures by the following formula: ln(Enrolled) = 10.2248 + 0.0491206*Length (R2 = 0.0545, p = 0.029). The correlation between the variables is positive, indicating courses that are longer attract a greater number of enrolments. The relationship is relatively weak, accounting for 5.5% of the variance observed, although the sample size is sufficiently large for this to be a statistically significant relationship. This positive correlation may suggest that prospective MOOC students prefer more substantial courses (however, see also the relationship between course length and completion rates).
In addition, the relationship between university ranking and enrolment figures was considered, although it was not found to be significant at the 95% level.
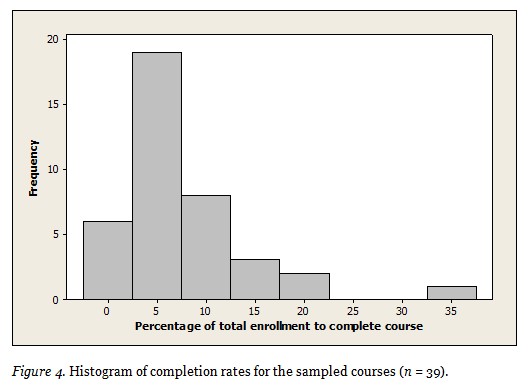
Completion rates were calculated as the percentage of students (out of the total enrolment for each course) who satisfied the criteria to gain a certificate for the course. This information was available for 39 courses in the sample. Completion rates range from 0.9% to 36.1%, with a median value of 6.5% (Figure 4). The data is skewed, so the higher completion rates are not representative, with completion rates of 5% being typical.
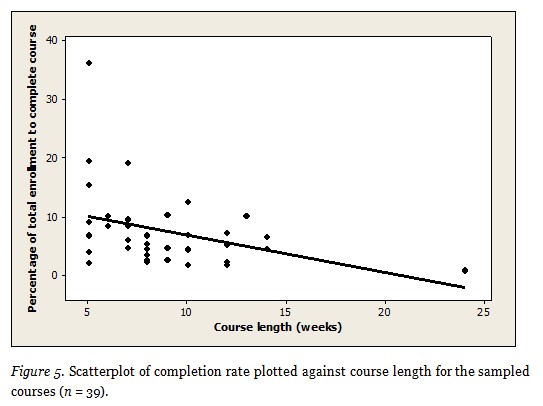
As the residuals were not normally distributed, a Box-Cox transformation was again carried out before conducting regression analysis. No significant relationships were found between completion rate and date, university ranking, or the total number of students enrolled. Completion rates remained consistent across these factors. A significant negative correlation was found however between completion rate and course length, shown in Figure 5. Regression analysis showed that course length significantly predicted completion rate by the following formula: ln(PercentTotalCompleted) = 2.64802 - 0.100461*CourseLength (R2 = 0.2373, p = 0.002). The correlation in this case is negative, indicating that a lower proportion of students complete longer courses. Course length accounts for 23.4% of the variance observed, and the correlation is significant at the 95% significance level.
While considering completion rate as the percentage of the total enrolment that complete the course is the type of data that is most readily available, a criticism of this characterization is that many students may enroll without even starting the course, and that completion rates would be better characterized as the proportion of active students who complete. This level of information is available for a subset of the sampled courses (39 courses with a number of active students and total enrolment; 33 courses with data about the proportion of active students who complete).
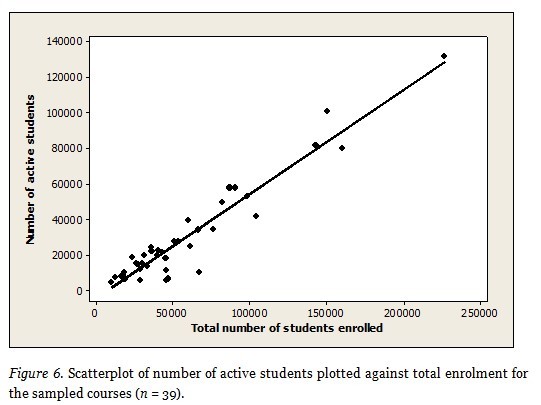
The number of active students is remarkably consistent as a proportion of the total enrolment of the course (with approximately 50% of the total enrolment becoming active students). This is shown graphically in Figure 6. Regression analysis showed that total enrolment significantly predicted the number of active students by the following formula: Active = 0.543336*Enrolled (R2 = 0.9556, p < 0.001). The correlation is strong (accounting for 95.6% of the variance) and positive, showing a consistent relationship between total enrolment and the percentage who become active students (being approximately 54% of those who enroll).
When calculating completion rate as the percentage of active students who complete the course, completion rates range from 1.4% to 50.1%, with a median value of 9.8% (Figure 7). While completion rates as a percentage of active students span a wider range than completion rates as a percentage of total enrolments, there remains a strong skew towards lower values. The differences here would be worthwhile to explore in further detail to explore features of course design that may account for the wider variation observed.
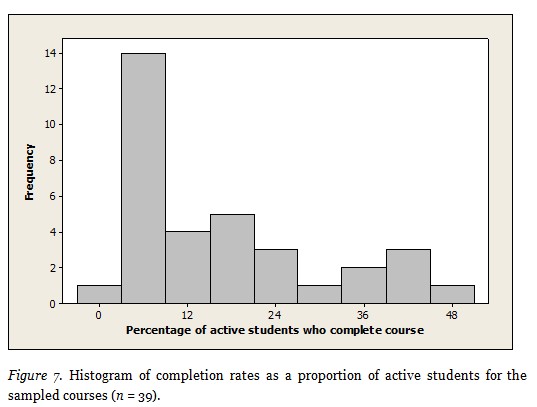
No significant relationships were found between completion rate as a proportion of active users and date, university ranking, total enrolment, or (in contrast to completion rate as a percentage of total enrolment) course length. This may suggest that enrolled students may be put off starting longer courses, but this is less of an issue for those who do become actively engaged in the course.
The findings here demonstrate changes in the field since the concept of MOOCs entered the mainstream and the inception of the major MOOC platforms. It is misleading to invoke early enrolment and completion figures as representative of the phenomenon; six-figure enrolments are atypical, with the median average enrolment being 42,844 students, and decreasing over time as the number of courses available continues to increase. Although this is lower than the earliest examples, it emphasizes that it is inappropriate to compare completion rates of MOOCs to those in traditional bricks-and-mortar institution-based courses.
The majority of courses have been found to have completion rates of less than 10% of those who enroll, with a median average of 6.5%. The definition of completion rate used here is the percentage of enrolled students who satisfied the courses’ criteria in order to earn a certificate, and this definition was used because it is the type of information that is most frequently available. There are potentially many ways in which MOOC students may participate in and benefit from courses without completing the assessments. The wider range of completion rates (while still remaining quite low overall, with a median of 10%) observed when defining completion as a percentage of active learners in courses is interesting and warrants further work to better understand the reasons why those who become engaged initially do or do not complete courses.
This is not to say, however, that completion rates should be ignored entirely. Looking at completion rates is a starting point for better understanding the reasons behind them, and how courses could be improved for both students and course leaders. For example, the relationship between enrolments, completion, and course length is an interesting issue for MOOC course design, balancing the higher enrolments with the lower completion rates of longer courses. Figures about how many students achieved certificates obscure how many students attempted to gain a certificate but did not meet the criteria. Given that MOOCs are offered free of educational prerequisites, striving to improve teaching on courses so that students who wish to complete are assisted in doing so is an important pedagogical issue. The extent of understanding that can be gained outside of running a MOOC will continue to be constrained however as long as the release of detailed data about courses is limited.
This study has only considered relationships between enrolment and completion and a small number of general factors for which data is available publicly; various other factors would be worthwhile to explore. For example, it would be useful to look at in terms of the underlying pedagogy, whether differences emerged based on how transmissive (so-called ‘xMOOCs’) or connectivist (‘cMOOCs’) courses are. The impact of different assessment types, being necessarily linked to the criteria for achieving a certificate of completion, would also be a worthwhile area to consider in further detail. Along with the studies discussed in the introduction which focus upon links between student demographics or behaviours and completion (Breslow et al., 2013; Kizilcec et al., 2013; Koller et al., 2013), a limitation of the approach used here is that the data neglects the student voice. While these approaches can identify trends and patterns, they are unable to explore in detail the reasons behind the trends observed.
The author would like to thank Professor Martin Weller and the two anonymous peer reviewers for their comments on drafts of this paper. Special thanks to all of the MOOC students, instructors and other commentators who contributed data and thoughtful comments about MOOC completion rates to the authors’ blog.
Adhikari, A. (2013). Completion. Stat2x, Spring 2013 blog. Retrieved from http://stat2x.blogspot.co.uk/2013/04/completion.html
Anderson, N. (2012). Grades are in for a pioneering free Johns Hopkins online class. The Washington Post. Retrieved from http://www.washingtonpost.com/blogs/college-inc/post/grades-are-in-for-a-pioneering-free-johns-hopkins-online-class/2012/11/14/1bd60194-2e6b-11e2-89d4-040c9330702a_blog.html
Anderson, S. (2013). Duke Sports and Society MOOC wraps up. Duke Center for Instructional Technology blog: http://cit.duke.edu/blog/2013/07/duke-sports-and-society-mooc-wraps-up/
Arnaud, C. H. (2013). Flipping chemistry classrooms. Chemical & Engineering News. Retrieved from http://cen.acs.org/articles/91/i12/Flipping-Chemistry-Classrooms.html
Balch, T. (2013a). About MOOC completion rates: The importance of student investment. The Augmented Trader blog: http://augmentedtrader.wordpress.com/2013/01/06/about-mooc-completion-rates-the-importance-of-investment/
Balch, T. (2013b). MOOC student demographics. The Augmented Trader blog: http://augmentedtrader.wordpress.com/2013/01/27/mooc-student-demographics/
Barber, M. (2013). Comment posted on the Introduction to Operations Management page. Coursetalk.org: http://coursetalk.org/coursera/an-introduction-to-operations-management
Belanger, Y. (2013). IntroAstro: An intense experience. Retrieved from http://hdl.handle.net/10161/6679
Belanger, Y., & Thornton, J. (2013). Bioelectricity: A quantitative approach. Duke University’s First MOOC: http://dukespace.lib.duke.edu/dspace/bitstream/handle/10161/6216/Duke_Bioelectricity_MOOC_Fall2012.pdf
Breslow, L., Pritchard, D. E., DeBoer, J., Stump, G. S., Ho, A.D., & Seaton, D. T. (2013). Studying learning in the worldwide classroom: Research into edX’s first MOOC. Research and Practice in Assessment, 8, 13-25.
Burnette, D. (2012). The way of the future. The University of Virginia Magazine. Retrieved from http://uvamagazine.org/features/article/the_way_of_the_future#.UdrX_1Pp6ic
Burton, G. (2013). Did they just say, “39,000 students enrolled in my Improvisation course?” OMG!. Garyburton.com news/opinion: http://www.garyburton.com/opinion/did-they-just-say-30000-students-enrolled-in-my-improvisation-course-omg/
Campbell, G. (2013). The technicity story, part 2. The Technicity Story blog: http://blogs.lt.vt.edu/technicitystory/2013/04/24/the-technicity-story-part-2/
Cervini, E. (2012) Mass revolution or mass con? Universities and open courses. Crikey: http://www.crikey.com.au/2012/12/18/mass-revolution-or-mass-con-universities-and-open-courses/?wpmp_switcher=mobile
Chu, J. (2013). Duflo, Lander, Lewin to lead spring-semester MITx courses. MIT News: http://web.mit.edu/newsoffice/2013/mitx-spring-offerings-0131.html
Clark, S. (2013). Coursera – Introduction to music production by Loundon Stearns. Bytes and Banter blog: http://bytesandbanter.blogspot.co.uk/2013/06/coursera-introduction-to-music.html
Coursera. (2012). (DRAFT) Data export procedures. Retrieved from https://docs.google.com/viewer?a=v&pid=forums&srcid=MDMyNTg5NzM4OTAxMTY2NDg5NzEBMDEwNDAzNzI4ODgxODU0NTkwODQBLTkwOXZQa2huODRKATQBAXYy
Daniel, J. S. (2012). Making sense of MOOCs: Musings in a maze of myth, paradox and possibility. Journal of Interactive Media in Education. Retrieved from http://www-jime.open.ac.uk/jime/article/view/2012-18
Devlin, K. (2012a). Liftoff: MOOC planning – part 7. Devlin’s Angle blog: http://mooctalk.org/2012/09/21/mooc-planning-part-7/
Duke Today. (2012). Introduction to genetics and evolution, a preliminary report. Duke Today: http://today.duke.edu/node/93914
Emanuel, E. J. (2013). Online education: MOOCs taken by educated few. Nature, 503(342). Retrieved from http://dx.doi.org/10.1038/503342a
Evans, T. (2013). Here’s the scoop on Ohio State MOOCs. Digital Union, Ohio State University: http://digitalunion.osu.edu/2013/04/01/osu-coursera-moocs/
Farkas, K. (2013). Case Western Reserve University’s free online courses exceeded expectations. Cleveland.com: http://www.cleveland.com/metro/index.ssf/2013/07/case_western_reserve_universit_9.html
Ferraro, K. (2013). Nutrition consulting. Ingrain Health: http://www.ingrainhealth.com/nutrition-consulting.html
Florida Public Health Training Center. (2013). A public health refresher course. Florida Public Health Training Center Online Mentor Program blog: http://phmentorships.wordpress.com/2013/02/01/a-public-health-refresher-course/
Friedrich, A. (2013). UMN faculty: MOOCs have made us rethink learning. On Campus: http://blogs.mprnews.org/oncampus/2013/07/umn-faculty-moocs-have-made-us-rethink-learning/
Furman University. (2013). TEDx FurmanU 2013 Redesigning Education Cast. Tedxfurmanu.com website: http://www.tedxfurmanu.com/#!2013/c1g5h
Gillies, M. (2013). Creative programming for digital media & mobile apps. Marco Gillies webpage at Goldsmiths, University of London: http://www.doc.gold.ac.uk/~mas02mg/MarcoGillies/creative-programming-for-digital-media-mobile-apps/
Grafen, A., & Hails, R. (2002). Modern statistics for the life sciences. Oxford: Oxford University Press.
Guzdial, M. (2013). Slides from “The revolution will be televised” MOOCopalpse panel. Computing Education blog: http://computinged.wordpress.com/2013/03/09/slides-from-the-revolution-will-be-televised-moocopalypse-panel/
Harder, B. (2013). Are MOOCs the future of medical education? BMJ Careers: http://careers.bmj.com/careers/advice/view-article.html?id=20012502
Hawkins, D. (2013). Massive open online courses (MOOCs): The Thursday plenary session. Against the Grain Blog: http://www.against-the-grain.com/2013/06/massive-open-online-courses-moocs-the-thursday-plenary-session/
Head, K. (2013). Inside a MOOC in progress. The Chronicle of Higher Education. Retrieved from http://chronicle.com/blogs/wiredcampus/inside-a-mooc-in-progress/44397
Heussner, K. M. (2013). More growing pains for Coursera: In another slip-up, professor departs mid-course. Gigaom: http://gigaom.com/2013/02/19/more-growing-pains-for-coursera-in-another-slip-up-professor-drops-out-mid-course/
Jordan, K. (2012). Networked life, social network analysis, & a new appreciation for feedback. MoocMoocher blog: http://moocmoocher.wordpress.com/2012/12/21/networked-life-social-network-analysis-a-new-appreciation-for-feedback/
Jordan, K. (2013). Synthesising MOOC completion rates. MoocMoocher blog: http://moocmoocher.wordpress.com/2013/02/13/synthesising-mooc-completion-rates?
Kapsidelis, K. (2013). U. Va. set to launch global classrooms. Times Dispatch. Retrieved from http://www.timesdispatch.com/news/local/education/college/u-va-set-to-launch-global-classrooms/article_53fbd2b8-8bb1-58ff-8928-1eaca612a103.html
Kenyon, A. (2013). Healthcare Innovation and Entrepreneurship final comments. Duke Center for Instructional Technology blog: http://cit.duke.edu/blog/2013/07/healthcare-innovation-and-entrepreneurship-final-comments/
Kizilcec, R. F., Piech, C., & Schneider, E. (2013). Deconstructing disengagement: Analyzing learner subpopulations in massive open online courses. Third International Conference on Learning Analytics and Knowledge, LAK ’13 Leuven, Belgium.
Koller, D., & Ng, A. (2013). The online revolution: Education for everyone. Seminar presentation at the Said Business School, Oxford University, 28th January 2013. Retrieved from http://www.youtube.com/watch?v=mQ-K-sOW4fU&feature=youtu.be
Koller, D., Ng, A., Do, C., & Chen, Z. (2013). Retention and intention in massive open online courses: In depth. Educause Review. Retrieved from http://www.educause.edu/ero/article/retention-and-intention-massive-open-online-courses-depth-0
Kolowich, S. (2013, March 21). The professors who make the MOOCs. The Chronicle of Higher Education. Retrieved from http://chronicle.com/article/The-Professors-Behind-the-MOOC/137905/#id=overview
Leckart, S. (2012). The Stanford education experiment could change higher education forever. Wired Magazine. Retrieved from http://www.wired.com/wiredscience/2012/03/ff_aiclass/3/
Lesiewicz, A. (2013). Drugs and the brain. ATA Science & Technology Division blog: http://ata-sci-tech.blogspot.co.uk/2013/02/drugs-and-brain.html
Lewin, T. (2012a). College of future could be come one, come all. The New York Times. Retrieved from http://www.nytimes.com/2012/11/20/education/colleges-turn-to-crowd-sourcing-courses.html
Lewin, T. (2012b). One course, 150,000 students. The New York Times. Retrieved from http://www.nytimes.com/2012/07/20/education/edlife/anant-agarwal-discusses-free-online-courses-offered-by-a-harvard-mit-partnership.html?ref=education
Lugton, M. (2012). Review of the Coursera Human Computer Interaction Course blog: http://reflectionsandcontemplations.wordpress.com/2012/07/14/review-of-the-coursera-human-computer-interaction-course/
Malan, D. J. (2013). This was CS50x. CS50 blog: https://blog.cs50.net/2013/05/01/0/
Masolova, E. (2013). Interview with Daphne Koller, CEO of COURSERA. Eduson blog: https://www.eduson.tv/blog/coursera
McKenna, L. (2012). The big idea that can revolutionize higher education: ‘MOOC’. The Atlantic. Retrieved from http://www.theatlantic.com/business/archive/2012/05/the-big-idea-that-can-revolutionize-higher-education-mooc/256926/
Meyer, R. (2012). What it’s like to teach a MOOC (and what the heck’s a MOOC?). The Atlantic. Retrieved from http://www.theatlantic.com/technology/archive/2012/07/what-its-like-to-teach-a-mooc-and-what-the-hecks-a-mooc/260000/
Miller, H., & Odersky, M. (2012). Functional programming principles in Scala: Impressions and statistics. Scala Documentation website: http://docs.scala-lang.org/news/functional-programming-principles-in-scala-impressions-and-statistics.html
Moran, M. (2013). Free online nutrition course kicks off May 6th. Vanderbilt News. Retrieved from http://news.vanderbilt.edu/2013/05/coursera-nutrition/
Nelson, B. (2013). UF offers massive online learning for free. 1565today.com: http://1565today.com/uf-offers-massive-learning-online-for-free/
Novicki, A. (2013). Medical Neuroscience in Coursera has just finished. Duke Center for Instructional Technology blog: http://cit.duke.edu/blog/2013/07/coursera-medical-neuroscience-week-3/
Pappano, L. (2012). The year of the MOOC. The New York Times. Retrieved from http://www.nytimes.com/2012/11/04/education/edlife/massive-open-online-courses-are-multiplying-at-a-rapid-pace.html?pagewanted=1
Pattison, P. (2013). Coursera songwriting course starts July 19th. Patpattison.com: http://www.patpattison.com/news/entry?id=16
Posey, J. (2013). Free Penn online course offers lessons on growing old. Penn News. Retrieved from http://www.upenn.edu/pennnews/news/free-penn-online-course-offers-lessons-growing-old
Princeton University. (2012). Office of Information Technology administrative report, September 07, 2012. Retrieved from http://www.princeton.edu/oit/about/oit-administrative-report/PDFs/Admin_09-12.pdf
Riddle, R. (2013a). Preliminary results on Duke’s third Coursera effort, “Think Again”. Duke Center for Instructional Technology blog: http://cit.duke.edu/blog/2013/06/preliminary-results-on-dukes-third-coursera-effort-think-again/
Riddle, R. (2013b). Duke MOOCs: Looking back on “Image and Video Processing”. Duke Center for Instructional Technology blog: http://cit.duke.edu/blog/2013/06/looking-back-on-image-and-video-processing/
Rivard, R. (2013). Three out of 2U. Inside Higher Ed. Retrieved from http://www.insidehighered.com/news/2013/05/17/three-universities-back-away-plan-pool-courses-online
Rodriguez, C. O. (2012). MOOCs and the AI-Stanford like Courses: Two successful and distinct course formats for massive open online courses. European Journal of Open, Distance, and E-Learning. Retrieved from http://www.eurodl.org/index.php?article=516
Roth, M. S. (2013). My modern experience teaching a MOOC. The Chronicle of Higher Education. Retrieved from http://chronicle.com/article/My-Modern-MOOC-Experience/138781
Rushakoff, H. (2012). Free to learn: Geology, chemistry, and microeconomics are among U of I’s first free online courses on Coursera. University of Illinois at Urbana-Champaign College of Liberal Arts & Sciences News. Retrieved from http://www.las.illinois.edu/news/2012/coursera/
Schmoller, S. (2012). Peter Norvig’s TED talk reflecting on creating and running the online AI course. Schmoller.net: http://fm.schmoller.net/2012/07/peter-norvigs-ted-talk-about-the-ai-course.html#more
Schmoller, S. (2013). Second report from Keith Devlin’s and Coursera’s Introduction to Mathematical Thinking MOOC. Schmoller.net: http://fm.schmoller.net/2013/06/second-report-from-keith-devlins-itmt-course.html
Severance, C. (2012). Internet history, technology and security (IHTS) grand finale lecture slides. Retrieved from http://www.slideshare.net/fullscreen/csev/internet-history-technology-and-security-grand-finale-lecture-20121001/7
Sharma, Y. (2013). Hong Kong MOOC draws students from around the world. The Chronicle of Higher Education. Retrieved from http://chronicle.com/article/Hong-Kong-MOOC-Draws-Students/138723/?cid=wc&utm_source=wc&utm_medium=en
Siegel, A. F. (2011). Practical business statistics (6th ed.). Oxford: Academic Press.
Siemens, G. (2012). MOOCs are really a platform. Elearnspace blog: http://www.elearnspace.org/blog/2012/07/25/moocs-are-really-a-platform/
Signsofchaos blog. (2013). An assessment of a MOOC. Signsofchaos blog: http://signsofchaos.blogspot.co.uk/2013/07/an-assessment-of-mooc.html
Simply Statistics. (2012). Computing for data analysis (Simply statistics edition). Simply Statistics blog: http://simplystatistics.org/2012/10/29/computing-for-data-analysis-simply-statistics-edition/
St. Petersburg College. (2013). Alex Sharpe successfully completes University of Toronto online course via Coursera. The CCIT Bulletin, St. Petersburg College. Retrieved from http://www.spcollege.edu/ccit-bulletin/?p=1012
Stauffer, J. (2013). Connected Arctic educators discussion thread. https://plus.google.com/114587962656605254648/posts/fmLmhDE9cSk
Times Higher Education. (2013). World university rankings 2012-2013. Retrieved from http://www.timeshighereducation.co.uk/world-university-rankings/2012-13/world-ranking
Unger, M. (2013). Eye on the future: Coursera. Penn Current. Retrieved from http://www.upenn.edu/pennnews/current/2013-02-21/eye-future/eye-future-coursera
University of Edinburgh. (2013). MOOCs @ Edinburgh 2013 – Report #1. University of Edinburgh: http://www.era.lib.ed.ac.uk/bitstream/1842/6683/1/Edinburgh%20MOOCs%20Report%202013%20%231.pdf
University of Michigan. (2012). Halderman’s “Securing Digital Democracy” opens on Coursera. Department of Electrical Engineering and Computer Science: http://www.eecs.umich.edu/eecs/about/articles/2012/Halderman_Coursera_launch.html
University of Virginia. (2013). U. Va. Darden School’s first Coursera class reaches 71,000 registrants. University of Virginia Darden School of Business News. Retrieved from http://www.darden.virginia.edu/web/Media/Darden-News-Articles/2013/Dardens-First-Coursera-Class-Reaches-71000-Registrants/
Weinzimmer, S. (2012). Rice’s first Coursera class enrolls 54,00. The Rice Thresher. Retrieved from http://www.ricethresher.org/rice-s-first-coursera-class-enrolls-54-000-1.2932146#.UcsMlJw1DTo
Welsh, D. H. B., & Dragusin, M. (2013). The new generation of massive open online courses (MOOCs) and entrepreneurship education. Small Business Institute Journal, 9(1), 51-65.
Wesleyan University. (2013). Passion driven statistics. Wesleyan University Quantitative Analysis Center: http://www.wesleyan.edu/qac/student-profile/homepage_slideshow_coursera_information.html
Werbach, K. (2012). Gamification course wrap-up. PennOpenLearning YouTube channel: http://www.youtube.com/watch?v=NrFmiqhBep4
Werbach, K. (2013). Gamification Spring 2013 statistics. Coursera Gamification YouTube channel: http://www.youtube.com/watch?v=E8_3dNEMukQ&feature=youtu.be
Williams, K. (2013). Emory and Coursera: Benefits beyond the numbers. Emory news center: http://news.emory.edu/stories/2013/05/er_coursera_update/campus.html
Widom, J. (2012). From 100 students to 100,000. ACM SigMod Blog: http://wp.sigmod.org/?p=165
Yuan, L., & Powell, S. (2013). MOOCs and open education: Implications for higher education (JISC CETIS white paper). Retrieved from http://publications.cetis.ac.uk/2013/667
Zhou, H. (2013). Duke University completes its first “Introductory Human Physiology” MOOC! Duke Center for Instructional Technology blog: http://cit.duke.edu/blog/2013/06/reflection-physio/