


|
|
|
Osman Yildiz1, Abdullah Bal1, and Sevinc Gulsecen2
1Yildiz Technical University, Turkey, 2Istanbul University, Turkey
It is essential to predict distance education students’ year-end academic performance early during the course of the semester and to take precautions using such prediction-based information. This will, in particular, help enhance their academic performance and, therefore, improve the overall educational quality. The present study was on the development of a mathematical model intended to predict distance education students’ year-end academic performance using the first eight-week data on the learning management system. First, two fuzzy models were constructed, namely the classical fuzzy model and the expert fuzzy model, the latter being based on expert opinion. Afterwards, a gene-fuzzy model was developed optimizing membership functions through genetic algorithm. The data on distance education were collected through Moodle, an open source learning management system. The data were on a total of 218 students who enrolled in Basic Computer Sciences in 2012. The input data consisted of the following variables: When a student logged on to the system for the last time after the content of a lesson was uploaded, how often he/she logged on to the system, how long he/she stayed online in the last login, what score he/she got in the quiz taken in Week 4, and what score he/she got in the midterm exam taken in Week 8. A comparison was made among the predictions of the three models concerning the students’ year-end academic performance.
Keywords: Distance education; academic performance; fuzzy logic; genetic algorithm; online learning
Two out of every three people use the Internet, according to a report published by the International Telecommunication Union in 2012. Similarly, the National Center for Education Statistics (NCES) reported that the number of students who took at least one course via distance education significantly increased from 1.1 million in 2002 to 12.2 million in 2006 (Brain Track, 2013). These two reports suggest that an increase in Internet use leads to a corresponding demand for distance education. Considering the advantages distance education offers, it is easy to project a further increase in the demand. Even so, distance education has its own drawbacks such as lack of motivation on the part of the individuals and limited dialogues with instructors. These disadvantages cause students to quit distance education. The number of students leaving distance education is higher than those quitting formal education (Kotsiantis, Pierrakeas, & Pintelas, 2003).
In traditional education, instructors enjoy the opportunity to observe student behaviors, which is a key contribution to testing and evaluation. On the other hand, observation is impossible in distance education. The purpose of this study is to offer a solution to the problem. In distance education, student performance can be tracked thanks to logs in the learning management system. These logs enable one to record how long a student studies teaching materials, how long he/she is active in the system, how successful he/she is in the quizzes taken, how active he/she is in the forums on the subjects, and how many messages he/she posts or reads. An analysis of these logs allows student performance to be predicted in the middle of the semester.
The objective of assessment activities for an evaluation of student performance is not to grade students or to provide them with a certificate or other similar documents if they prove to be successful; instead, the objective is to have the opportunity to revise and improve the education and assessment instruments so that educational activities can be enhanced as a whole (Simonson, Smaldino, Albright, & Zvacek, 2003). Therefore, predicting student performance offers a number of benefits both to the organization and to instructors. Predicting student performance early at the beginning of the academic year enables one to take precautions so that high-risk students will not face adverse consequences later on.
The present study was based on predicting distance education students’ year-end academic performances using a fuzzy-based model. The input data were comprised of particular variables in the learning management system as well as the results of the quiz in Week 4 and the midterm exam in Week 8.
A review of literature suggests that there are similar studies on the issue. A number of international publications have attempted to predict student performance using machine learning techniques. International publications share one characteristic: They are involved in predictions based on the categories “pass” or “fail” as a standard for performance (Zafra & Ventura, 2009). Such studies only predict whether a student can pass or fail. They have recommended that further studies could focus on predicting student grades and attempt to find the minimum length of time sufficient for prediction before the final exam.
Lykourentzou et al. (2009) used multiple genetic algorithms on the basis of an evaluation of results derived from three different methods to predict whether a student would quit a course or school. The study employed test results, project evaluations, and demographics (Lykourentzou, Giannoukos, Nikolopulos, Mpardis, & Loumos, 2009).
In another study, Vandamme et al. (2007) attempted to predict who would fail in a course or quit the school. To do so, they used artificial neural networks by classifying students under low, medium, or high-risk groups depending on such data as demographics, socio-economic background, and academic background (Vandamme, Meskens, & Superby, 2007).
Dimitris and Christos (2006) predicted distance education students’ academic performance using genetic algorithm and decision trees. In another study, Zafra and Ventura (2009) predicted whether students would pass or fail a course using multiple instance genetic algorithms. The study was based on student activities in the form of quizzes, assignments, and forums.
The research by Kalles and Pierrakeas (2004) analyzed students’ academic performance through the academic years measuring students’ homework assignments, and implemented short rules that explain success and predict success or failure in the final exams. Ibrahim and Rusli (2007) used neural network, decision tree, and linear regression to estimate students’ academic performance. In this work, they used demographic profiles and students’ first semester cumulative grade point averages (CGPA) to predict final CGPA.
It is essential in distance education to predict students’ year-end academic performance in the middle of the academic year. Such prediction can enable one to take precautions for improving not only student performance but also the efficiency of distance education. Therefore, the present study attempted to find an answer to the following questions:
The data for the study were initially on a total of 242 students who enrolled in Basic Computer Sciences at Yildiz Technical University during the 2011-2012 academic year. Since 24 of them had not participated in any of the activities in distance education throughout one semester, they were excluded, which meant that the study was conducted on 218 students. Demographics were not incorporated into the analysis. The data consisted of five inputs and one output. Out of the inputs, three were collected through Moodle, the distance education program on which the classes were based. These inputs were recency, which stood for the last time a student logged on to the section of the system related to the course; frequency, which represented the frequency at which a student logged on to the system; and monetary, which showed the amount of time (minutes) a student spent on the section of the system related to the course. Firstly, the data on the first six weeks starting from the beginning of the semester were collected through Moodle in the form of logs. The log file was comprised of approximately 55,000 lines. The software written in the Matlab environment ensured that recency, frequency, and monetary values could be calculated in these crowded data for each student. The fourth input was the results of the quiz administered online through Moodle in Week 4. The fifth input was the results of the midterm exam administered formally in Week 8. Within the scope of the course, students were required to take three online quizzes, two midterm exams, and one final exam. All these exams had their own influence on the year-end academic performance. To put it in a more clear way, three online quizzes, two midterm exams, and one final exam represented 20%, 40%, and 40% of the year-end academic performance respectively.
A fuzzy inference system was modeled so as to predict distance education students’ year-end academic performance. First, a classical fuzzy was modeled. Then, it was remodeled in accordance with expert opinion. Finally, the model was optimized via genetic algorithm.
In classical sets, an element is a member of a set or not. In mathematical terms, when an element belongs to a set, its degree of membership in that set is “1”. However, when it is not a member of a set, its degree of membership in that set is “0”. In fuzzy logic, nevertheless, each member has a value of membership that ranges between 0 and 1. Moreover, one element can be a member of more than one set. Take the statement that “those who are above 1.85 m. in length are tall”. According to classical logic, those who are above 1.85 m in length are tall, but those who are 1.85 m in length are not tall. In contrast, fuzzy logic asserts that a person who is 1.85 m in length is tall with a 0.9 degree of membership and of medium height with a 0.1 degree of membership.
Not everything in our lives is comprised of 1s and 0s as in classical sets. Rather, they have a number of uncertainties. In today’s world, fuzzy logic is commonly used for modeling and solving a problem dominated by uncertainties.
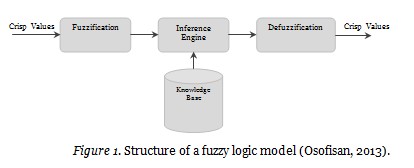
Fuzzy logic generally contains three stages. Fuzzification is the process where actual values as inputs in the system are blurred. Each input value is assigned a value of membership and turned into linguistic forms. The second stage is where rules are processed. Here, rules are derived in the form of “if then”. Inputs are handled in accordance with the rule table. The third stage, defuzzification, involves transforming fuzzy values into actual values. Figure 1 presents the structure of a common fuzzy system.
The reason for using a fuzzy logic in the present study is its advantages. These are the facts that models can be established in an easy way through linguistic variables, imprecise/contradictory inputs are allowed, rules can be established in an easy way to design the model, and linguistic terms between input variables and output variables can be understood easily (Valluru, 1995).
Apart from these advantages of a fuzzy logic, its main disadvantage has been argued to be the necessity of establishing rules and membership function intervals in accordance with learned opinion (Taylan & Karagozoglu, 2009).
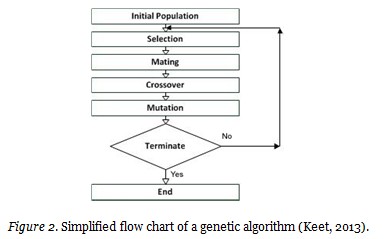
Genetic algorithm (GA) is a method of optimization that employs techniques associated with genetic process in living creatures in nature. Based on “the survival of the fittest”, it intends to find the best solution (Haupt & Haupt, 2004). GA works with a population of randomly generated individuals represented by chromosomes. Here, chromosomes are generally binary-encoded. The population has evolved toward better solutions using such genetic operators as crossover and mutation. In each new generation, the individual with the best solution generates new offspring, replacing those with poor solutions. Crossover hybridizes the genes of two parent chromosomes and generates child chromosomes. In this way, an increase is experienced in the number of individuals that will yield the best solution. The main component here is fitness function, which plays a role in deciding on good or bad solutions (Cordon, Herrera, Hoffmann, & Magdalena, 2001). Mutation is the process of altering, at a randomly determined rate, the genes of the chromosomes of the individuals in the population. The reason for the process is to ensure that the next generation will not be the same as the preceding generation. Figure 2 shows the flow chart of genetic algorithm.
Fuzzy model has two significant steps following the determination of input and output variables. These are establishing fuzzy rules and determining membership function intervals.
Fuzzy rules can be created depending on data or by consulting experts. In this study, rules are generated by consulting experts. Some rules of the model are as follows.
1. If (recency is very poor) and (frequency is poor) and (monetary is very poor) and (quiz is medium) and (midterm is poor) then (academic performance is poor)
2. If (recency is poor) and (frequency is medium) and (monetary is very good) and (quiz is poor) and (midterm is poor) then (academic performance is poor)
3. If (recency is poor) and (frequency is poor) and (monetary is poor) and (quiz is very poor) and (midterm is poor) then (academic performance is poor)
…
12. If (recency is very good) and (frequency is very poor) and (monetary is very good) and (quiz is very good) and (midterm is medium) then (academic performance is medium)
13. If (recency is very good) and (frequency is very poor) and (monetary is very good) and (quiz is very poor) and (midterm is poor) then (academic performance is medium)
14. If (recency is very good) and (frequency is very poor) and (monetary is very good) and (quiz is very poor) and (midterm is very good) then (academic performance is medium)
…
49. If (recency is medium) and (frequency is good) and (monetary is very good) and (quiz is very good) and (midterm is very good) then (academic performance is good)
50. If (recency is medium) and (frequency is medium) and (monetary is very poor) and (quiz is very poor) and (midterm is very poor) then (academic performance is good)
51. If (recency is medium) and (frequency is medium) and (monetary is good) and (quiz is very good) and (midterm is very good) then (academic performance is good)
The other most significant components of fuzzy logic systems is membership functions. Figure 3 shows a triangular membership function.
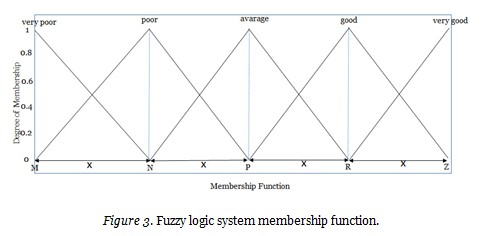
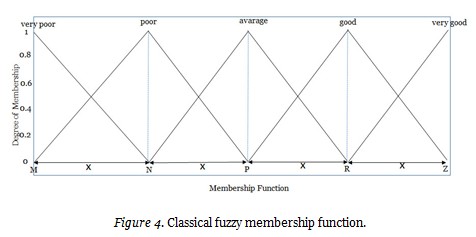
A membership function consists of shapes comprised of its own linguistic terms. The most commonly used ones are triangular, trapezoidal, or parabolic in shape. The present study is based on triangular membership functions. Each linguistic term has a particular interval value. In classical fuzzy, these intervals are determined through a number of operations. However, experiences are emphasized in the system based on expert opinion. In gene-fuzzy, starting and ending values of these intervals are determined for each membership function following the stages of genetic algorithm. Algorithm is inserted into the cycle until the optimum result is found. Determined intervals are transferred to the fuzzy logic system. This method is assumed to yield a better result than classical fuzzy, which is based on simple mathematical calculations, and expert fuzzy, which is dominated by experiences.
The fuzzy logic system constructed in this study had five inputs and one output. The former included recency, frequency, monetary, results of quiz, and midterm 1. The latter was year-end academic performance. One particular triangular membership function was determined for each input and output. Maximum and minimum points were identified on the data via normal distribution. The intervals for membership functions were revealed using these points (M, N, P, R, Z).
X = 95% in Normal Distribution
Y = 5% in Normal Distribution
Z = Highest value in each data set
T = Lowest value in each data set
Max = Greatest (X,Z)
Min = Smallest (Y,T)
a = (Max-Min)/4
M = Min
N = Min+a or Max-3a
P = Min+2x or Max-2x
R = Min+3x or Max-x
Z = Max
All these calculations yielded the following membership function:
The data for the study were on a total of 218 students. While 70% of the data were randomly chosen as educational data, the remaining 30% were identified as test data. The intervals of the membership functions for each input and output were determined through the process specified above. The following is an example of how the intervals of monetary membership function were determined.
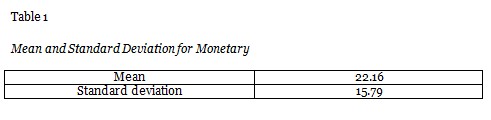
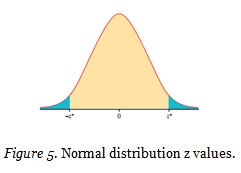
First, the values that corresponded to the top 5% and bottom 5% according to normal distribution were identified via the following formula:

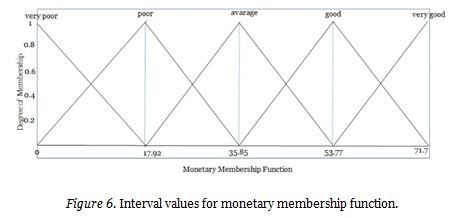
Whereas z* value for the top 5% was -1.65, the one for the bottom 5% was +1.65 (Moore, McCabe, & Craig, 2009). The formula yielded the values x = -3.90 and x = 48.23. Since the minimum value was negative, it was accepted as limit value. Maximum value in monetary was 71.7 and thus higher than 48.23. Therefore, maximum value was taken as 71.7. In order to generate a fuzzy logic membership function, it was necessary to identify the limits for the categories “poor”, “average” and “good”. For that reason, the lower limit was subtracted from the upper limit and it was divided by 4 in order to obtain interval values: x = (71.7-0) / 4 = 17.92
Interval for the category “poor” (N) = 0+17.92 = 17.92
Interval for the category “average” (P) = 17.92 + 17.92 = 35.85
Interval for the category “good” (R)= 35.85 + 17.92 = 53.77
Figure 6 presents the monetary membership function determined with the data above.
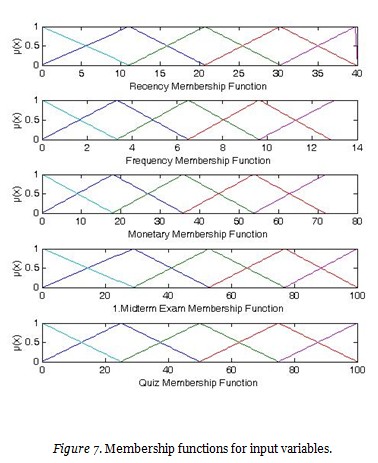
The same process was followed for the other data as well, which yielded the membership functions presented in Figure 7.
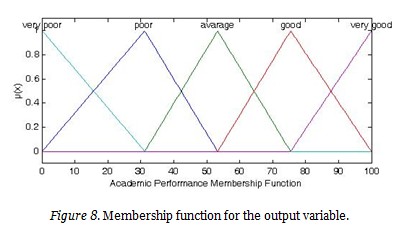
The membership function for the output variable is presented in Figure 8.
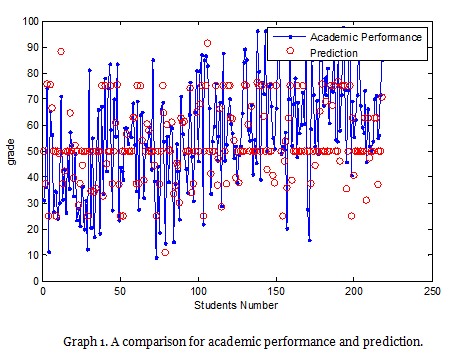
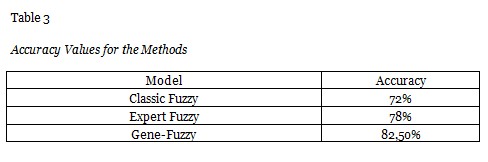
When inputs were entered into the system to make predictions, the accuracy rate was nearly 72%.
The following is a comparison graph for the results.
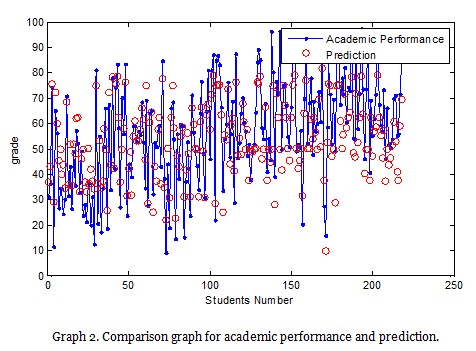
The most important criteria for a fuzzy logic model are membership functions and forming rules. Membership functions are chosen by trial and error, which might take a long time. It is another significant step to determine intervals for inputs. Experiences are essential at this point. One can predict results more accurately in a fuzzy logic model based on expert opinion. In addition to the fuzzy logic model constructed in the classical way, the present study also included another model based on experiences. To exemplify, the limit for recency, which recorded how many days passed before a student logged on to the system after a particular class was uploaded to it, was [0,42]. This meant that students logged on to the system and studied the class 0 to 42 days after it had been uploaded to the system. In the classical fuzzy logic, intervals for categories “good”, “average” and “poor” were determined by subtracting the minimum from the maximum and dividing it by 4. In this case, the limit for “good” should be [0 11 20]. This meant that a student would be a member of the category “good” with a degree ranging from 0 and 1 if he/she logged on to the system 0 to 20 days after the class had been uploaded to the system. Considering the fact that revising within seven days would ensure better understanding, the interval for the category “good” was changed to [0 7 14] in the model based on experiences. In addition to recency membership function, frequency and monetary membership functions were also changed to generate an expert fuzzy model. The results reported that the model had a mean accuracy rate of 78.62%.
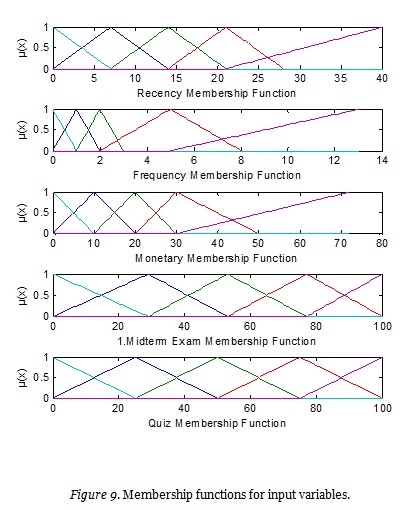
Figure 9 presents the membership functions for the expert fuzzy model.
The following is a comparison graph for the results obtained from the expert fuzzy model.
It is rather difficult to enhance the accuracy of results that are obtained from the method based on trial and error and expert opinion for determining the intervals of membership functions. Therefore, the intervals were optimized through genetic algorithm, a method of optimization based on natural selection and evolution. The objective was to maintain those intervals that could yield the best result in a population of randomly generated numbers, to generate better intervals, and to reach the interval that could yield the best result. The stages of genetic algorithm are briefly presented below:
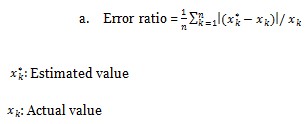
Error ratios for five intervals were calculated out of 100. The results are presented in the following table.
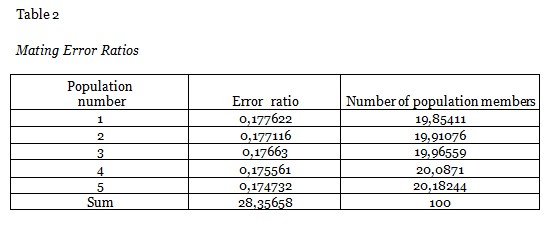
The results suggest that the first population with an error ratio of 17.76% would have 20 places in a set comprised of 100 populations. Similarly, the member of the population with an error ratio of 17.47% that could yield the best result would have 20 places. In this way, a new population pool was built.
Figure 10 presents the ultimate status of the intervals following iteration.
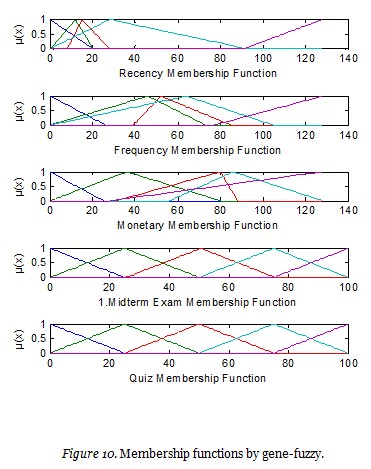
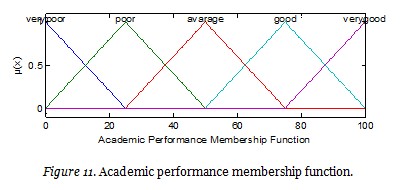
Figure 11 presents the membership function for the output.
The following is a comparison graph for the results obtained by 70% random optimization. Iteration was operated 1000 times. In the end, 70% of the data, which were chosen randomly, had an accuracy rate of 82.5%.
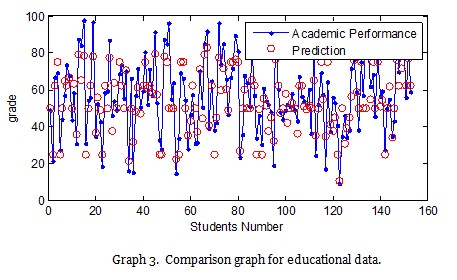
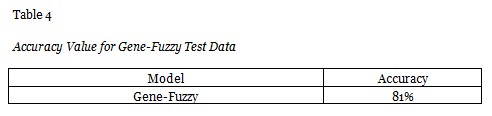
The following is a comparison graph for the results obtained with the remaining 30% of the data. The accuracy rate for the 30% of the data was 81.11%.
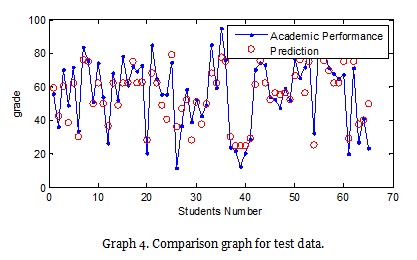
Table 3 presents the accuracy values for the three methods used in the study.
The accuracy values for the predictions with the remaining 30% of the data are presented in Table 4.
Some of the significant results of a survey on 2500 universities in the United States are as follows:
These results suggest that supply and demand for distance education is increasing at a breakneck pace. The characteristics of distance education compared to formal education, coupled with rapid advances in technical infrastructure, mean that the increase will be more and more significant. However, it is inevitable that the disadvantages of distance education will increase as well unless necessary precautions are taken. The present study reports results that are likely to prevent these disadvantages from increasing. Thanks to the study, both students and instructors will have a clear idea about the general situation and take necessary precautions in the middle of the semester.
The present study was conducted on distance students enrolled in Basic Computer Sciences. Further studies could focus on different courses and provide comparative results. The present study did not take the demographics of the participants into account. Further studies could build other models that also include demographics and present results in comparison with those of the present study. In addition, further studies could find intervals for fuzzy logic membership functions through clustering methods.
The model used in the present study can be adapted to the learning management system. In this way, it will be possible to predict distance education students’ academic performance early during the semester on the basis of real-time data.
The present study concludes that fuzzy logic systems enable one to validly predict a distance student’s year-end academic performance on the basis of the first eight-week data. His/her year-end academic performance can be predicted in accordance with the data on how many days pass before he/she logs on to a class after it has been uploaded to the system, how often he/she logs on to the class, how long he/she stays online in the class, how well he/she scores in the online quiz taken in Week 4, and how well he/she scores in the midterm exam taken in the classroom in Week 8. In this respect, the lowest result is provided by the classic fuzzy model. More accurate results are obtained from the fuzzy model that is based on expert opinion as well as the gene-fuzzy model, which is based on the optimization of the intervals for membership functions using genetic algorithm.
The best result is provided by the gene-fuzzy model, which is based on the optimization of the intervals for membership functions using genetic algorithm.
Allen, E., & Seaman, J. (2013). Class differences: Online education in the United States (2010). Retrieved from http://sloanconsortium.org/sites/default/files/class_differences.pdf
Brain Track (2013). Online education continues rapid growth. Retrieved from http://www.braintrack.com/online-colleges/articles/online-education-continues-to-grow
Cordon, O., Herrera, F., Hoffmann, F., & Magdalena, L. (2001). Genetic fuzzy systems. Danvers: World Scientific.
Haupt, R. L., & Haupt, S. E. (2004). Practical genetic algorithms. New Jersey: John Wiley & Sons.
Keet, M. (2013, 04 16). Genetic algorithms - An overview. Retrieved from http://www.meteck.org/gaover.html
Lykourentzou, I., Giannoukos, I., Mpardis, G., Nikolopoulos, V., & Loumos, V. (2009). Early and dynamic student achievement prediction in e-learning courses using neural networks. JASIST, 372-380.
Lykourentzou, I., Giannoukos, I., Nikolopoulos, V., Mpardis, G., & Loumos, V. (2009). Dropout prediction in e-learning courses through the combination of machine learning techniques. Computers & Education, 950-965.
Osofisan, P. B. (2013). Fuzzy logic control of the syrup mixing process in beverage production. Retrieved from http://ljs.academicdirect.org/A11/093_108.htm
Moore, D., McCabe, G., & Craig, B. (2009). Introduction to the practice of statistics. New York: W. H. Freeman and Company.
Simonson, M., Smaldino, S., Albright, M., & Zvacek, S. (2003). Teaching and learning at a distance. NJ: Pearson Education.
Taylan, O., & Karagozoglu, B. (2009). An adaptive neuro-fuzzy model for prediction of student’s academic performance. Computers & Industrial Engineering, 732-741.
Valluru, R. (1995). C++ neural networks and fuzzy logic. M&T Books, IDG Books Worldwide.
Vandamme, J. -P., Meskens, N., & Superby, J. -F. (2007). Predicting academic performance by data mining methods. Education Economics, s. 405-419.
Zafra, A., & Ventura, S. (2009). Predicting student grades in learning management systems with multiple instance genetic programming. Educational Data Mining, 307-314.