


|
|
|
|
Miroslava Raspopovic1, Aleksandar Jankulovic1, Jovana Runic1, and Vanja Lucic2
1Belgrade Metropolitan University, Serbia, 2Yew Wah School of Shanghai, China
In this paper, DeLone and McLean’s updated information system model was used to evaluate the success of an e-Learning system and its courses in a transitional country like Serbia. In order to adapt this model to an e-Learning system, suitable success metrics were chosen for each of the evaluation stages. Furthermore, the success metrics for e-Learning evaluation are expanded by providing several systems for quantifying the given success metrics. The results presented in this paper are based on courses that were taught both online and traditionally in three different subject areas: graphic design, information technology, and management. Of particular interest were success metrics which can be determined using quantifiable data from the e-Learning system itself, in order to evaluate and find the relationship between students’ academic achievement, usage of learning materials, and students’ satisfaction. The results from different courses were used to illustrate the implementation and evaluation of these success metrics for both online and traditional students.
Keywords: e-Learning; distance learning; assessment factors
Innovations in computing disciplines have enabled development and implementation of e-Learning information systems in formal and informal education. The design and implementation of web-based e-Learning systems, defined as the process of extending learning or delivering instructional materials to remote sites (ITC, 1998; Waits & Lewis, 2003), have grown exponentially in the last years, benefitting from the fact that students and teachers can be in remote locations and that this form of computer-based education is virtually independent of any specific hardware platform (Romero et al., 2009).
Although substantial progress has been made to implement and use the Internet and computing technologies in learning, educators are still exploring different methods for the best presentation of learning materials, as well as the best practices for effective presentation of the material and students’ retention and understanding of presented information. Many educators are interested in using e-Learning systems; however, it is of great importance to have appropriate methods to evaluate the success of such systems.
Evaluation of an e-Learning system is both vital for accepting its value and efficiency as well as for its understanding and acceptance in the society, which is crucial for the further development and expansion of e-Learning. Various factors have been identified as important in the success of information systems. Success of e-Learning systems is not measurable with a single factor such as user satisfaction (Shee & Wang, 2008). Considering different e-Learning success factors in different countries, research of quality measurement in distance learning, different regions or countries, and whether a country is developed or not is of great importance, as these countries may face more challenges in successful implementation of new and innovative technology methods in education.
This paper expands the success metrics for e-Learning evaluation by providing several systems for quantifying the given success metrics (Raspopovic & Lucic, 2012). Sample metrics are evaluated based on the DeLone and McLean model and data gained from an e-Learning system built on Oracle iLearning platform. The paper focuses on three dimensions: use, user satisfaction, and net benefit. Of particular interest is to determine key factors within these dimensions that have an impact on academic success and the differences between academic success of traditional and online students. The goal of the paper is to find a correlation between different success factors in these three dimensions based on the case study on the University in Serbia.
E-Learning, as an instructional content or learning experience delivered or enabled by electronic technology (Pantazis, 2001), is placed between information and communication technology (ICT) and education. Progress in the field of e-Learning has been very slow, and some researchers have accredited this slow progress to problems mostly associated with the poor interface design of e-Learning systems (Zaharias, 2005). However, as users’ experience certainly does depend on the interface, it is not the only parameter significant to evaluation and expansion of e-Learning.
A large number of e-Learning success models are based on service quality and especially on the conceptual model SERVQUAL developed by Parasuraman et al. (1985). On the other hand, some authors suggest that evaluation of e-Learning systems should be done through various aspects because of their multidisciplinary character. Some of the models for evaluating success factors of e-Learning can be roughly characterized in three groups: technology acceptance model, user satisfaction model, and e-Learning quality model. The technology acceptance approach for evaluation of e-Learning mainly focuses on investigating factors that affect students when adopting the e-Learning system (Abad et al., 2009; Ngai & Chan, 2007). The user satisfaction assessment approach analyzes system success from the perspective of learner satisfaction investigating learners’ perceptions of the relative criteria (Shee & Wang, 2008; Jung et al., 2011). Shee and Wang found that various national, regional, and international initiatives have been undertaken with regard to quality assurance in e-Learning which implies the importance of regional research in this field. The e-Learning quality assessment approach evaluates the quality of the entire e-Learning system, not just the service quality. Success is analyzed in terms of structure, content, delivery, service, outcomes, and the quality perception of e-Learning (MacDonald & Thompson, 2005; Lee & Lee, 2008).
E-Learning evaluation is not a one-time activity, but rather a complex systematic process parallel to e-Learning development as well as its implementation. The best way to prepare the methodology for e-Learning evaluation should be the systematic approach (Dvorackova & Kostolanyova, 2012). The study of Ćukušić et al. (2009) in 14 schools from 10 European countries identifies the relationship between the systematic e-Learning management and the e-Learning performance, as well as the independence of e-Learning performance from the subject of e-Learning. According to them, the success of e-Learning seems to be determined by the systematic management of the process and educational institutions must adapt themselves by designing and managing e-Learning processes providing quick, targeted, inexpensive, and highly flexible information delivery to their users.
A number of studies confirm that the degree of learners’ satisfaction with e-Learning has been widely used to evaluate the effectiveness of e-Learning (Zhang et al., 2004; Levy 2007). Further research papers confirm a number of different proposed factors in different regions. Lee et al. (2009) in their research of learners’ acceptance of e-Learning in South Korea found that instructor characteristics and teaching materials are the predictors of the perceived usefulness of e-Learning, and perceived usefulness and playfulness are the predictors of the intention to use e-Learning. Jung’s research (2012) presented Asian learners’ perception of quality in distance education based on the presented research from the EU, India, the USA, Australia, South Korea, China, and on this basis proposed a conceptual model of 10 dimensions and 3 domains (supportive, pedagogical, environmental) which could be used as a framework for distance learner providers in Asia. On the basis of the theory of multi-criteria decision making and user satisfaction from the fields of human-computer interaction, Shee and Wang (2008) proposed a multi-criteria methodology from the perspective of learner satisfaction with 13 criteria and 4 dimensions: learner interface, learning community, system content, and personalization. In their study, Wang and Chiu (2011), developed a theoretical model to assess user satisfaction and loyalty intentions to an e-Learning system using communication quality, information quality, system quality, and service quality. They confirmed that the improvement of these categories is very useful for sustaining loyal users of e-Learning systems. Selim (2007) specified e-Learning critical success factors (CSFs) perceived by university students of United Arab Emirates grouped into four categories, namely instructor (professor), student, information technology, and university support. Volery and Lord (2000) identified three CSFs in e-Learning, technology, instructor, and previous use of technology, from the perspective of an Australian university student. The study of Bhuasiri et al. (2012) identifies the CSFs that influence the acceptance of e-Learning systems in 25 developing countries from Asia, the Middle East, South America, Africa, and Europe. This study categorizes e-Learning success factors into seven dimensions based on several theories such as social cognitive theory, IS success model, and motivation theory. The seven dimensions include: learners’ characteristics, instructor’s characteristics, e-Learning environment, institution and service quality, infrastructure and system quality, course and information quality, and motivation. A study of three qualities in e-Learning international benchmarking projects shows that various aspects of accessibility, flexibility, interactive-ness, personalization, and productivity should be embedded in all levels of management and services within the field of e-Learning in higher education (Ossiannilsson & Landgren, 2012).
A number of studies proposed models for e-Learning applications evaluation. O’Droma et al. (2003) in their research about architectural and functional design of e-Learning delivery platforms and applications and learning management systems (LMS) on the e-Learning platform reference model of the Institute of Electrical and Electronics Engineers (IEEE) Learning Technology Standards Commitee’s (LTSC), found that this model provides a good basis for the evaluation of e-Learning. In their study, Ozkan and Koseler (2009) proposed a conceptual e-Learning assessment model suggesting a multi-dimensional approach for LMS evaluation via six dimensions: system quality, service quality, content quality, learner perspective, instructor attitudes, and supportive issues. In a survey of 163 e-Learning experts regarding 81 validation items developed through literature review, Kim and Leet (2008) proposed suitability of design, interoperability of system, and user accessibility among seven factors defined in their research for evaluating LMSs: suitability of design in screen and system; easiness of course procedure; interoperability of system and suitability of academy administration; easiness of instruction management and appropriateness of multimedia use; flexibility of interaction and test and learner control; variety of communication and test types; user accessibility. Usability of e-Learning applications plays a significant role in e-Learning success. A consolidated evaluation methodology of e-Learning application does not yet exist or is not well documented and widely accepted (Ardito et al., 2006). In their research Ardito et al. (2006) proposed methodology for systematic usability evaluation (SUE) for the evaluation of e-Learning applications with four dimensions: presentation; hypermediality; application proactivity; user activity. Granic (2008) reported about the experience with the usability assessment of intelligent learning and teaching systems and suggested that the main issues regarding universal design related to e-Learning systems include: learner-centered design paradigm, context of use approach, individualized approach, pedagogical framework, and guideline framework. For the evaluation of e-Learning systems statistical analysis of data used by learners are of great importance. In the research of Hogo (2010), the Logo Pro tool was used for statistical analysis and description. The obtained pattern from this tool may be very useful in collecting some statistics about the data and the tool provided good feedback to the e-Learning systems about the monthly, weekly, and daily traffic on the site as well as the types of data needed and the important directories for the students. In the research of Hassanzadeh et al. (2012) combining models and previous studies, a model for measuring e-Learning system success entitled MELSS is presented with components suitable for measuring e-Learning systems, such as technical system quality, educational system quality, content and information quality, service quality, user satisfaction, intention to use, user loyalty to system, benefits of using the system, and goal achievement. Roca et al. (2006) applied the technology acceptance model (TAM) and found that the users’ intention is determined by their satisfaction, which is determined by the perceived usefulness, information quality, confirmation, service quality, system quality, perceived ease of use, and cognitive absorption. Previous studies are in accordance with the DeLone and McLean model.
One of the very important factors for e-Learning success is the time spent on learning via LMS. Romero and Barbera (2011) examined the impact of quantity and quality of academic time spent learning (time-on-task) by students enrolled in online education programs. Time quality in online learning depends on their availability, willingness, and motivation to devote quality cognitive time to online learning tasks. They found positive relation between the time-on-task devoted by students and their academic performance, and discovered that a higher performance is connected to activities during the morning and weekend days. Grabe and Christopherson (2008) in their study found that students made very little use of the audio recordings and that the use of online lecture resources and examination performance were positively related.
The DeLone and McLean model investigates the factors which are used for evaluating the success of designing and delivering information systems (DeLone & McLean, 2003). In this model the authors took into account both the technological aspects of an information system and different individual and organizational impacts. The DeLone and McLean model was very often cited (until 2002 285 refereed papers in journals and proceedings). Most frequently papers investigated the associations among the measures identified in a model, multiple success dimensions and their relationships, the association between system use, system quality and information quality to individual impacts and extensions and recommendations (DeLone & McLean, 2003). On the basis of this entire work, they proposed an updated IS success model.
Holseapple and Lee-Post (2006) adapted DeLone and McLean’s updated success model and expanded it to assess the e-Learning system. Holseapple and Lee-Post have fully defined a success metrics for evaluation of a Blackboard e-Learning system. This paper examines the success factors adopted from DeLone and McLean’s model, while expanding on the success metrics, which are used for the evaluation of e-Learning systems. They suggest that there is a need to formulate holistic and comprehensive models for assessing and evaluating e-Learning programs. According to Wang et al. (2010), Holseapple and Lee-Post adopt an open system perspective on general systems theory of Von Bertalanfy (1950) stating that wholes function the way they do due to the arrangements of the components and their interaction with each other. Wang et al. (2010) offer a model for evaluation based on the socio-technical system theory evaluating distance learning from the instructor’s perspective where distance learning can be viewed as a socio-technical system. Previous studies based on DeLone and McLean’s model argue the need for a systematic approach for e-Learning modeling.
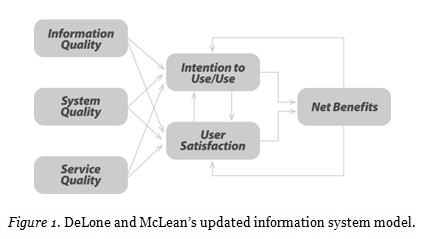
The e-Learning assessment model presented in this study is adopted from DeLone and McLean’s updated information system model. This model presumes that evaluation is conducted by incorporating assessment factors grouped in six categories: information quality, system quality, service quality, use, user satisfaction, and net benefits (Figure 1). Even though this model has been used for evaluation of many different types of information systems, success metrics for each evaluation dimension need to be specified in order to be system specific. DeLone and McLean in their work specified success metrics related to evaluation of eCommerce systems, while Holseapple and Lee-Post (2006) defined sample metrics for evaluation of e-Learning systems based on the Blackboard platform.
A particular interest of this paper is to investigate the model in the context of e-Learning information systems. The results, which are discussed later in this paper, are collected from the e-Learning that uses Oracle iLearning as an e-Learning platform. Furthermore, metrics that are used are related to this platform and educational systems used in online and traditional style education in Serbia. Evaluating e-Learning systems on other platforms may need adjustment in modifying the metrics.
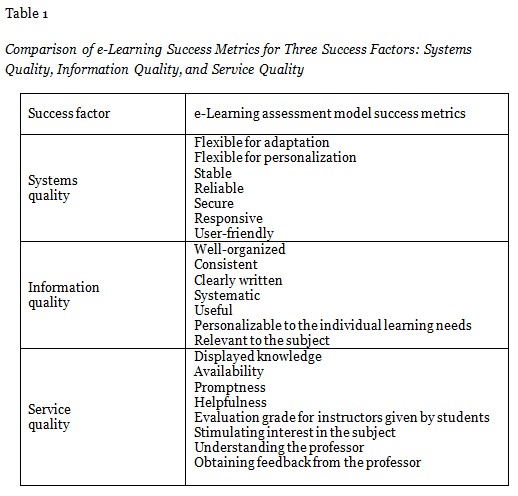
The first three dimensions of assessment in the DeLone and McLean model are system quality, information quality, and service quality. These three dimensions represent quality assessment for system design. In the context of e-Learning, system quality evaluates the characteristics and effectiveness of the used platform such as flexibility, stability, reliability, security, responsiveness, and user-friendliness. Information quality evaluates the quality of course content and can use success metrics such as clarity, organization, presentation, and currency of course materials. Service quality evaluates the quality of student-instructor interaction and can use metrics such as promptness, availability, helpfulness, and organization and clarity of the lectures. The proposed success metrics for these three evaluation dimensions are given in Table 1. These metrics are very similar to the metrics used for any other information system. System quality tends to evaluate the technological portion of the system; therefore, this metric will not be the scope of this paper. However, other dimensions are discussed in the later sections.
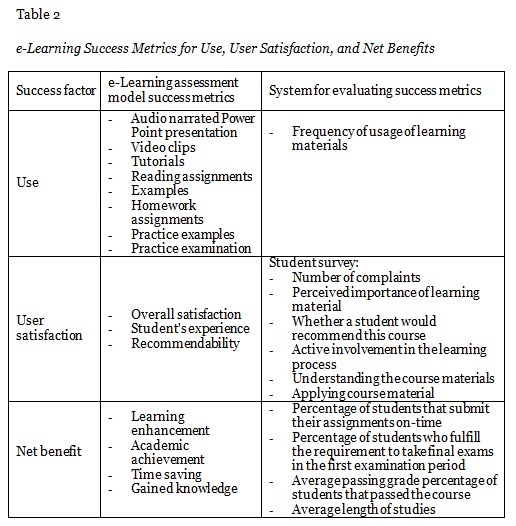
The use evaluation dimension measures the degree to which the learning material is used, comparing it with its effectiveness. These materials may include audio narrated PowerPoint presentations, video clips, reading assignments, examples, tutorials, homework assignments, practice examples, practice examinations, and so on. The user satisfaction quality factor takes into consideration students’ overall satisfaction with the course, their experience, and whether they would recommend this course and style of learning to others.
The final stage of the evaluation of the success of the e-Learning system is the analysis of the system’s outcome, both positive and negative, through the net benefit. Ultimately, it is necessary to evaluate learning enhancement, academic achievement, time saving, and overall knowledge received and retained by students. However, according to DeLone and McLean’s updated information systems model, there are also certain negative aspects in the evaluation. In the context of e-Learning, the negative aspects that should be taken into consideration are social isolation, dependence on technology, and quality concerns.
Some of the aforementioned metrics in all six dimensions of evaluation of e-Learning are not easily quantifiable. Some of them are based on the students’ attitude, and their intention to use certain materials, while others take into consideration individual perceptions. Table 2 shows success metrics and proposes several methods which can be used to provide quantifiable results for their evaluation. Even though the surveys can be used to quantify the majority of the given metrics, their susceptibility to individual perception and attitudes may give biased results.
In this paper we investigate the statistical metrics that can be derived from information quality, service quality, use, user satisfaction, and net benefit success factors. These data were obtained from the e-Learning system using Oracle iLearning as a platform. In the presented results we try to find the relation between these success factors. The presented results involve iterations through all stages of evaluation. First, in the net benefit factor we analyze the academic achievement and performance through two success metrics: percentage of students who took the final exams and percentage of students that passed the course. Second, we analyze the connection between net benefit and use factors, and whether academic achievement relates to the frequency of usage of learning materials. We also analyzed whether there was a statistically significant difference between students who had and had not passed the exam depending on the average percentage of used learning materials. The null hypothesis states that this difference is not statistically different. In order to accept or reject null hypothesis, the independent sample t-test was used. Third, we iterate between user satisfaction, information quality and service quality success metrics in order to determine how these success factors are connected.
Research was conducted in several stages. In the first stage, students were enrolled in 6 undergraduate classes in three different study areas: management (60 online and 53 traditional students), graphic design (34 online and 43 traditional students), and information technology (111 online and 113 traditional students). From each study area, two courses were selected based on their passing rates in previous semesters, one with high and another with low passing rates. All of these courses were offered both for online and traditional students. Both traditional and online students were provided with the same learning materials and course assignments. Traditional students had in-class lectures and instructions, while online students were provided with online consultations through email, forums, and Skype.
In the second stage, data were collected from the e-Learning system. Data that were collected included:
The number of students who took the final exam was used to determine taken-exam rates, and the number of students who passed the course was used to determine the passing rates. Taken-exam rate represents the ratio of the number of students who took the exam and the total number of students registered for the course. The passing rate is defined as the ratio of the number of students who passed the exam and the total number of students registered for the course. These indicators were analyzed aggregated, but also separately for traditional and online students. These two indicators were chosen due to the educational style at the university in Serbia. It is mandatory that students complete their tests, homework tasks, and projects with a satisfactory grade, before they are allowed to take the final exam. Students are allowed to take final exams during any of the eight provided examination periods, once they have completed their requirements.
This study tries to identify whether academic success is related to students’ activities in the class. Hence, the frequency of usage of learning materials on the e-Learning system was analyzed. These materials included audio narrated PowerPoint presentations along with the reading materials. In all six courses, materials were divided into 15 separate lectures, each providing one audio presentation and one written lesson for each lecture, along with course assignments and tests. Results were examined in the context of finding a connection between the time spent on the system and studying all of the provided materials. Students spent a certain amount of time in order to download written portions of materials that were provided as PDF documents. Presuming that they have reasonable internet connection, which is the case in most instances for students in Serbia, they could have spent the least amount of time on the system performing this activity. On the other hand, listening to an audio narrated PowerPoint presentation requires more time to be spent on the system.
In the third stage, at the end of the course, students filled out a questionnaire which involved a series of questions that allowed them to express their satisfaction with a series of factors that may have influenced their overall satisfaction, experience, and future recommendability of the course. Linear dependence between all parameters was analyzed using Pearson correlation method, in order to analyze the correlation between variables and to determine whether the existing correlation is strong and statistically significant. As Pearson’s relation coefficient, r, is given in the range between -1 and 1, 1 indicating perfect positive linear correlation, we have taken into account positive and strong correlation that is indicated when r is greater than 0.5. This signifies that increase in one variable indicates increase of the other variable, and vice versa, decrease of one variable indicates the decrease of the other variable.
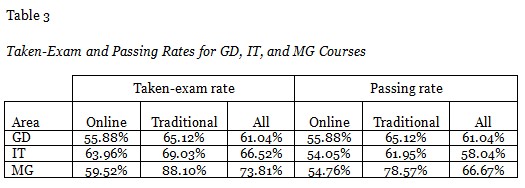
The first evaluation stage focused on the success metrics for evaluating the net benefit factor through the academic performance and achievements. Of particular interest was to determine the percentage of students who took the final exam (taken-exam rate) and percentage of students who passed the final exam (passing rate). These results are shown for the three study areas: graphic design (GD), management (MG), and information technology (IT). Table 3 shows comparison of taken-exam and passing rates for online and traditional students in all three areas. It can be noticed that for students who are studying graphic design, these two rates are identical. For management and IT students these rates differ, but not significantly. This may indicate that students are adequately prepared for the final exams, which is most likely the result of a high emphasis on satisfactory completion of the course assignments and tests. Results show that the taken-exam rate for traditional students is the highest for IT, 66.52%, while the lowest one is for MG, 57.52%. On the other hand, taken-exam rate of online students is the highest for IT, 63.96%, while it is the lowest for MG, 43.33%. Furthermore, it can be noticed that online students are less successful in passing the courses in all of the three areas. However, the most significant difference in the passing rates between online and traditional students can be seen with MG students. This can be caused by additional factors that should be further studied, such as students’ motivation, personalization of learning materials, and suitability of the particular study area to be an online course. However, these factors are out of the scope of this research paper. On the other hand, it will be seen in the results that follow that subjects that require a more hands-on approach such as design and programming courses tend to have lower passing rates, leading to the conclusion that different pedagogical methods for online courses should be further analyzed and developed in order to increase learning efficacy for online students.
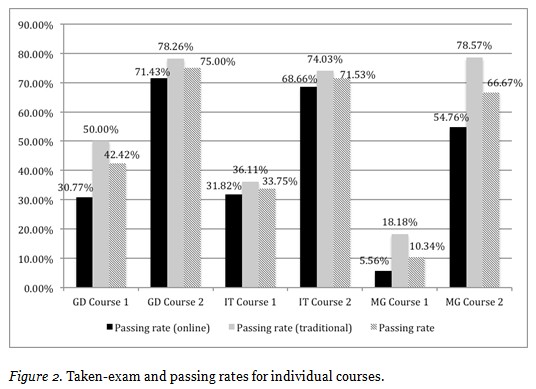
In order to further analyze academic achievement and performance through passing rates, comparisons were conducted at the course level for six different courses. Courses were selected based on their passing rates, so that within one area two courses can be compared, one with traditionally higher and another with traditionally lower passing rates. In all three cases the first course (i.e., IT course 1) is a course with a lower passing rate and the second one (i.e., IT course 2) is a course with a higher passing rate.
Figure 2 shows the chosen indicators at course level for GD, IT, and MG. All of the shown rates indicate that traditional students were more successful than online students. These findings are consistent with the previous results which were analyzed on the cumulative level, indicating the lower passing rates of internet students in all study areas. The gap between the passing rates of online and traditional students is the least pronounced in IT courses, and the most in MG courses. On the other hand, a similar effect occurs when we compare two GD courses. GD course 1 is a more hands-on course with a lot of drawing assignments, while GD course 2 is a more theoretical course. This also indicates that suitability of implementation of online studies may not be adequate for all types of courses and that different pedagogical methods should be implemented.
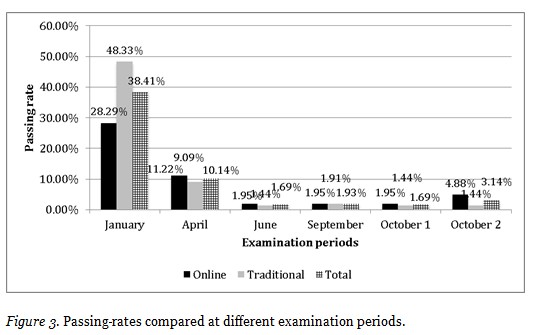
The educational system in Serbia mandates that students should be given a minimum of six final examination periods for a course. It is of interest to indicate in which examination period students have the highest passing rates, in order to determine their academic performance. Figure 3 shows taken-exam rates for courses in all three areas, analyzed based on the examination periods. Eight examination periods that are available throughout the academic year are labeled based on the month when they are conducted. It can be seen that the final examination periods taken in January, April, and June are the periods when most students fulfill the requirements to take the exams, as the passing rates are higher.
Nevertheless, taken-exam rates for online students, when analyzed for individual examination periods, are lower than the same rates for traditional students. January and June examination periods occur a few days after the end of the semester. Hence, this may indicate that students who are consistent with their course activities throughout the semester are most likely to be ready to take exams at the earlier times. Furthermore, higher passing rates during the early examination periods indicate the motivation and interest of students to study throughout the semester. Typically, traditional students are given hard deadlines for their assignments, while online students are given more flexibility and soft deadlines. The results point in the direction that new activities should be developed in order to engage online students to be more active throughout the semester. On the other hand, the optimal timeframe for deadlines for online students should be studied in order to drive them to be less passive and work consistently during the semester.
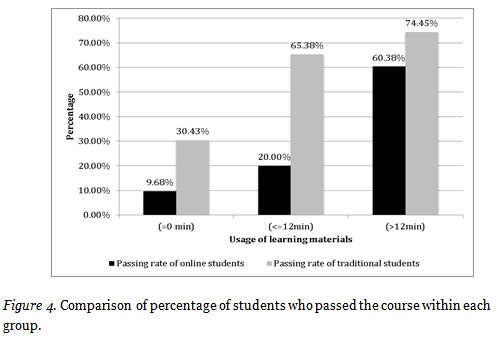
As we noticed, passing rates are lower for online students when compared to traditional students, and these metrics do differ between individual courses. Due to these findings we further analyze the use success metrics for these particular courses. It is of particular interest to analyze whether these academic success findings relate to the frequency of usage of learning materials posted on the e-Learning system.
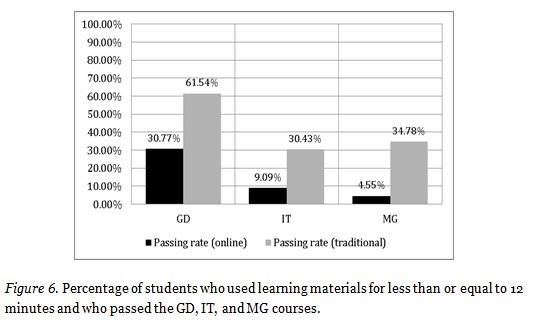
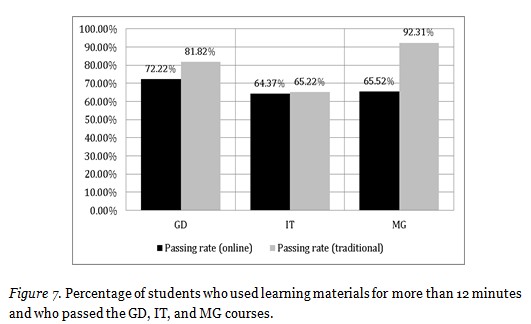
Students were divided in three groups based on the time spent on the system when they were using the learning materials: the group of students that did not use any of the learning materials (0 minutes), the group of students that used learning materials less than 12 minutes, and the group that used materials for longer than 12 minutes. As described previously, activities that relate to the second group of students who spent less than 12 minutes on the system using the material are most likely performing activities related to downloading written lectures (PDF format) and course assignments. Listening to audio narrated PowerPoint presentations requires more time, and this group of students is included in the third group. Figure 4 shows the comparison of the percentage of students who passed the course in each group for both online and traditional students. It can be noticed that for all three groups, the number of students who have passed the course increases as their time spent on the system also increases. Furthermore, there is a significant difference between the first and the second group. An interesting result occurred with the first group. In the first group of students who did not use the learning materials on the system, the percentage of students who passed the course was higher than zero. Intuitively, this rate might have been expected to be 0%, assuming that students did not study at all. However, the later analysis will show that the existing rate is mainly contributed by GD students, and a course that does not require theoretical background (Figure 4).
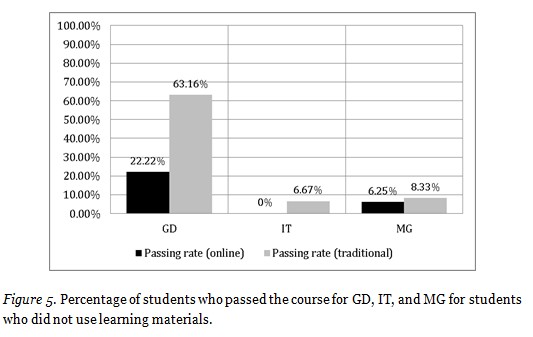
Out of all students who did not use materials on the system, GD students have the highest passing rates even though they did not use the materials. As many as 63.16% of GD traditional students who did not use learning materials on the system passed the course along with 22.22% of GD online students. As traditional students have in-class lectures, this high rate is not surprising considering the style of lectures and course assignments. Given that GD course 1 assignments are drawing and painting based it is more likely that students focused their time on doing the assignments without reading the posted materials. This strengthens the argument that different forms of learning materials should be considered for GD, such as video tutorials and other forms of visual and interactive demonstrations. On the other hand, none of the online IT students who did not use learning materials passed the course, while there were 6.25% of MG online students who did. Also, some of these students may have been students who retook these courses and may have been using previously downloaded materials.
Figures 6 and 7 represent the passing rates for students who used materials for less than or exactly 12 minutes and the groups of students who used learning materials for more than 12 minutes on the system, respectively. It can be seen that traditional students had a better passing rate than online students although they listened to the teaching material for less than 12 minutes, while online students showed a significantly lower passing rate in such short listening time, regardless of the course they took. When the length of listening was more than 12 minutes, the high passing rate was expressed in all courses. These findings are in accordance with research of Grabe and Christopherson (2008).
The presented results have shown us that there is a relationship between the usage of learning materials and academic success. Based on this, the null hypothesis, stating that there is no statistically significant difference between students who passed and those who did not pass the exam as compared to the average percentage of used learning materials, using the independent samples t-test was rejected. T-value of the independent samples t-test was 5.547 at significance level, p = 0.000, which is less than the limit value of 0.05. This signifies that the probability of error in rejecting the null hypothesis is equal to zero. Based on these results, we accept the alternative hypothesis, stating that there is a statistically significant difference between the students who passed and did not pass the exam depending on the percentage of the length of listening to learning materials. The average percentage of used learning materials among students who passed the course is 42.85% and 21.44% for students who did not pass the course. This is in accordance with the study of Romero and Barbera (2011).
At the end of the courses, students filled out the questionnaires that were used to analyze their satisfaction with the factors included in use satisfaction, information quality, and service quality factors. These analyses singled out the variables which demonstrated significant results such as students’ satisfaction with their professors and teaching assistants, as well as the manner in which they perceive the importance and quality of materials that related to theory (theoretical aspects), lab exercises (practical aspects), course assignments (tests, homework, and project), and consultations and interactions with professors and teaching assistants.
Linear dependence using Pearson correlation method was analyzed between these success metrics. Results from these questionnaires are expressed through correlation coefficient, r, and significance, p. A strong linear correlation (r > 0.5 and p < 0.05) was found between the importance of theoretical aspects and students’ satisfaction with teachers (r = 0.603), which signifies that students relate theoretical work and its importance to their satisfaction and work with their professors. In other words, students will give more importance to lectures and theory if they are satisfied with the professor. Similarly, there is a strong correlation between online tests and theoretical aspects (r = 0.579), which is not surprising considering that a majority of online tests are based on the questions that vastly relate to theory. On the other hand, students relate their satisfaction with teaching assistants with the importance of practical aspects (r = 0.614). The conclusion can be derived that assistance provided by teaching assistants improves the perception and acceptance of practical implementation of the studied subject. This poses another question of how online tests, and online evaluation methods in general, can be improved to involve a more interactive and problem solving approach in order to increase students’ satisfaction and perception about the importance of coursework beyond the classification that parts of a course are theoretical or practical.
There is a correlation between the course assignments, where correlation was found between perceived significance of homework with practical aspects of the course (r = 0.664), and homework and project assignments (r = 0.675). This again points out that students clearly distinguish what they perceive as theory and what is a more practical and problem solving approach. Furthermore, students found course assignments highly important if they ranked high satisfaction with consultations they had with professors and teaching assistants (practical aspects: r = 0.616; homework: r = 0.583; project: r = 0.516). Students who regularly go to the consultation and do homework attain more success at projects. This result is significant as the mentoring and more frequent interactions and discussions with students will lead to higher satisfaction and quality of educational system conducted through online studies or blended learning. The results of all of these indicators are important as they can be used to improve students’ perception of the quality of a course and in the long term their satisfaction with the quality of the academic program they are enrolled in.
This paper presented a model for evaluation of e-Learning success factors and its success metrics. Of particular interest were metrics that provide quantifiable data independent of students’ perception. The presented results involve iterations through the following stages of evaluation using Delone and McLean’s model: net benefit, use, user satisfaction, information quality, and service quality. Academic achievement and performance success factors compared traditional and online students, showing that online students showed lower taken-exam and passing rates. It was shown that while online students had lower passing rates in courses, one of the reasons for this may lie in the fact that the majority of them had never used the assigned learning materials. On the other hand, the passing rates and the frequency of usage of learning materials have shown that different types of courses may require a different pedagogical approach when presenting materials online. Similarly, the passing rates compared in three different areas, graphic design, information technology, and management, showed significant differences. It was shown increased length of time spent on using learning materials influenced the increase in passing rates, and that there is a statistically significant difference between the students who passed and did not pass the exam depending on the percentage of the used materials. A significant statistical difference was shown between success factors in user satisfaction, information quality, and service quality metrics. These parameters showed a significant relation between the usage of learning materials and students’ satisfaction with the interaction with their teachers.
Furthermore, in order to increase students’ engagement in the course throughout the semester further studies should be conducted such as analysis of students’ motivation, personalization of learning materials, different pedagogical methods that will increase interactivitiy, optimal deadline policy for assignment, and suitability of the particular study area to be delivered through e-Learning. Future research should focus on the analysis of whether all academic areas are suited for online studies, especially as this research has shown that success for online studies is different not only for different areas, but as well as for courses that may have more of a hands-on approach as compared to the more theoretical courses. Evaluation of the presentation styles and course structure for each course material should be further analyzed, as these indicators point out the existence of a clear distinction between things that students perceive as practical and theoretical. One step further should be made in the direction of structuring the learning materials with integrating an approach with a less noticeable border between theory and problem solving parts of the course. Most importantly, the results point in the direction that online students still require a lot of interaction throughout the course, so new methods for encouraging teamwork and consultations should be considered.
The work presented here was supported by the Serbian Ministry of Education and Science (project III44006).
Abbad M., Morris D., & de Nahlik C. (2009). Looking under the bonnet: Factors affecting student adoption of e-learning eystems in Jordan. The International Review of Research in Open and Distance Learning, 2, 1-25.
Ardito, C., Costabile, M., DeMarsico, M., Lanzilotti, R., Levialdi, S., Roselli T., & Rossano V. (2006). An approach to usability evaluation of e-learning applications. Universal Access of Information Society, 4, 270-283.
Bhuasiri, W., Xaymoungkhoun, O., Zo, H., Rho J. J., & Ciganek, A. (2012). Critical success factors for e-learning in developing countries: A comparative analysis between ICT experts and faculty. Computers and Education, 58, 843-855.
DeLone, W. H., & McLean, E. R. (2003). The DeLone and McLean model of information system success: A ten-year update. Journal of Management Information Systems, 4, 9–30.
Dvorackova, M., & Kostolanyova, K. (2012). Complex model of e-learning evaluation focusing on adaptive instruction. Procedia – Social and Behavioural Sciences, 47, 1068-1076.
Grabe, M., & Christopherson, K. (2008). Optional student use of online lecture resources: Resource preferences, performance and lecture attendance. Journal of Computer Assisted Learning, 24, 1-10.
Granic, A. (2008). Experience with usability evaluation of e-learning systems. Universal Access of Information Society, 7, 209-221.
Hassanzadeh A., Kanaani F., & Elahi S. (2012). A model for measuring e-learning systems success in universities. Expert Systems with Applications, 39, 10959-10966.
Hogo, M. (2010). Evaluation of e-learning systems based on fuzzy clustering models and statistical tools. Expert Systems with Applications, 37, 6891-6903.
Holseapple, C. W., & Lee-Post A. (2006). Defining, assessing, and promoting e-learning success: An information systems perspective. Decision Sciences, Journal of Innovative Education, 1, 67-85.
ITS (1998). Instructional Technology Council. Retrieved from http://www.itcnetwork.org
Jung, I. (2012). Asian learners perception of quality in distance education and gender differences. The International Review of Research in Open and Distance Learning, 2, 1-25.
Jung, I., Wong, T. M., Chen, L., Baigaltugs, S., & Belawati, T. (2011). Quality assurance in Asian distance education: Diverse approaches and common culture. The International Review of Research in Open and Distance Learning, 6, 63-83.
Kim, S. W., & Leet, M. G. (2008). Validation of an evaluation model for learning management systems. Journal of Computer Assisted Learning, 24, 284-294.
Lee B., Yoon J., & Lee, I. (2009). Learners’ acceptance of e-learning in South Korea: Theories and results. Computers and Education, 53, 1320-1329.
Lee J., & Lee W. (2008). The relationship of e-learner’s self-regulatory efficacy and perception of e-learning environmental quality. Computers in Human Behavior, 1, 32-47.
Levy, Y. (2007). Comparing dropouts and persistence in e-learning courses. Computers and Education, 2, 185-204.
MacDonald, C., & Thompson, T. (2005). Structure, content, delivery, service, and outcomes: Quality e-learning in higher education. The International Review of Research in Open and Distance Learning, 2, 1-25.
Ngai, E., Poon, J., & Chan, Y. (2007). Empirical examination of the adoption of WebCT using TAM. Computers and Education, 2, 250-267.
O’Droma, M., Ganchev, I., & McDonell, F. (2003). Architectural and functional design and evaluation of e-learning VUIS based on the proposed IEEE LTSA reference model. The Internet and Higher Education, 6, 263-276.
Ossiannilsson, E., & Landgren, L. (2012), Quality in e-Learning – a conceptual framework based on experiences from three international benchmarking projects. Journal of Computer Assisted Learning, 28, 42-51.
Ozkan, S., & Koseler, R. (2009). Multi-dimensional student’s evaluation of e-learning systems in the higher education context: An empirical investigation. Computers and Education, 53, 1285-1296.
Pantazis, C. (2001). Executive summary: A vision of e-learning for America’s workforce (Report of the Commission on Technology and Adult Learning). ASTD. Retrieved from http://www.learningcircuits.org/2001/aug2001/pantazis.html.
Parasuraman, A., Zeithaml, V. A., & Berry, L. L. (1985). A conceptual model of service quality and its implications for future research. Journal of Marketing, 4, 41-50.
Raspopovic, M., & Lucic, V. (2012). Analysis of e-Learning success factors. In Proceedings of the Third International Conference on e-Learning (pp. 102-107), Belgrade Metropolitan University, Belgrade, Serbia.
Roca, J. C., Chiu, C. M., & Martinez, F. J. (2006). Understanding e-learning continuance intention: An extension of the technology acceptance model. International Journal of Human-Computer Studies, 8, 683-696.
Romero, C., Gonzales, P., Ventura, S., del Jesus M. J., & Herrer, a. F. (2009). Evolutionary algorithms for subgroup discovery in e-learning: A practical application using Moodle data. Expert Systems with Applications, 2, 1632-1644.
Romero, M., & Barbera, E. (2011). Quality of learners time and learning performance beyond quantitative time-on-task. The International Review of Research in Open and Distance Learning, 5, 125-137.
Shee, D. Y., & Wang Y. S. (2008). Multi-criteria evaluation of the web-based e-learning system: A methodology based on learner satisfaction and its applications. Computers and Education, 50, 894-905.
Selim, H. (2007). Critical success factors for e-learning acceptance: Confirmatory factor models. Computers and Education, 49, 396-413.
Volery, T., & Lord, D. (2000). Critical success factors in online education. The International Journal of Educational Management, 5, 216-223.
Von Betalanffy, L. (1950). The theory of open systems in physics and biology. Science, 3, 23-29.
Waits, T., & Lewis L. (2003). Distance education at degree-granting postsecondary institutions: 2000-2001 NCES 2003-017. Washington DC: National Center for Education Statistics, US Department of Education.
Wand J., Solan, D., & Ghods, A. (2010). Distance learning success – a perspective from socio-technical systems theory. Behaviour and Information Technology, 3, 321-329
Wang, H., & Chiu, Y. (2011). Assessing e-learning 2.0 system success. Computers and Education, 57, 1790-1800.
Zaharias, P. (2005). E-learning design quality: A holistic conceptual framework. Encyclopedia of distance learning (Vol. 2). Hershey: Idea Group Inc.
Zhang, D., Zhao J. L., Zhou L., & Nunamaker J. F.Jr. (2004). Can e-learning replace classroom learning? Communication of the ACM, 5, 75-79.
Ćukušić, M., Alfirević N., Granić A., & Garača Ž. (2010). e-Learning process management and the e-learning performance: Results of a European empirical study. Computers and Education, 55, 554-565.