This meta-analysis research estimated and compared the differences between the academic performance of students enrolled in distance education courses relative to those enrolled in traditional settings, as demonstrated by their final course grades/ scores within the 1990-2002 period.
Eighty-six experimental and quasi-experimental studies met the established inclusion
criteria for the meta-analysis (including data from over 15,000 participating
students), and provided effect sizes, clearly demonstrating that: 1) in two
thirds of the cases, students taking courses by distance education outperformed
their student counterparts enrolled in traditionally instructed courses; 2)
the overall effect size d+ was calculated as 0.37 standard deviation
units (0.33 < 95% confidence interval < 0.40); and (3) this effect size
of 0.37 indicates the mean percentile standing of the DE group is at the 65th
percentile of the traditional group (mean defined as the 50th percentile).
The Telecommunications Revolution of the last two decades of the Twentieth Century has changed all aspects of life, public and personal. The Internet truly has cast a worldwide Web of almost instantaneously active, fiber optic strands that bind together the practical worlds of business and commerce, and facilitates the exchange of views in the various academic and non-academic disciplines. In response to this burgeoning exchange of ideas, education systems (mainly in the industrialized countries and at higher levels) have pursued new methods of delivering education.
From time immemorial, teacher-lecturing/ student-listening was the primary mode of traditional academic education. The delivery system for higher education has been a classroom setting with a professor giving a lecture and students listening and writing notes. Interaction between the professor and student has been viewed as an essential learning element within this arrangement (O’Malley and McCraw, 1999), often referred to as the “sage on the stage.”
Technological improvements such as printing machines, postal services, telephone, radio, television, and more recently the Internet, have been a driving force yielding new delivery methods and platforms. These new learning methods used to deliver distance education (DE) are proliferating exponentially in various learning programs, and leading some experts to predict that the “residential based model,” in the form of students attending classes at prearranged times and locations, will disappear in the near future (Blustain, Goldstein, and Lozier, 1999; Drucker, 1997, as cited in O’Malley, 1999). Although an expensive option today, video conferencing may create a virtual feeling that we are “back in the classroom.” Some forms of DE has progressed in concept and practice from an “anywhere,” to an “anytime,” to an “any pace” delivery method.
Academic and training communities have been continuously examining, assessing, criticizing, hallowing, and demonizing these new delivery methods as they appear. Without doubt, DE is of the highest relevance and importance to educators, students, and all other stakeholders. It is changing the physical face (i.e., massive buildings) of academic establishments. Students can now learn from the comfort of their homes or offices with no need to commute to campuses. Cutting-edge data are easily accessible on compact discs (CDs), portable personal computers (PCs), and have taken the place of instantly obsolete books. Online classrooms and libraries are replacing traditional campus facilities. Rather than requiring students to travel to a specific physical classroom or library, the Internet has facilitated the delivery of (nearly) unlimited learning resources to students.
Another facet of this change is evident in the increased accessibility of DE curricula and expert training and educational staff available at convenient venues for businesses and professional organizations. The need to train and develop employees on all levels has coincided with advances in new educational options. Organizations are continuously weighing the merits of in-house training versus sending candidates off-site to observe and train at other facilities. With the guidance of outside academic institutions specializing in DE training and development programs, human resource managers are implementing in-house DE programs. Access to courses, coaching, rotational assignments, and professional programs such as the American Management Association seminars, and university-sponsored Executive MBA programs, are now commonplace (Mondy, Noe, and Premeaux, 1999; Dessler, 1997; Westwood, 2001).
Distance education has existed for more than a century, although it has yet to be universally accepted relative to current and well-practiced face-to-face (F2F) programs provided by traditional brick and mortar institutions.
Some of the most frequently asked questions regarding DE, pertain to the quality of instruction and learning as compared to that experienced and achieved by students enrolled in F2F programs. Questions include: the cost of attendance compared to F2F institution; the needs of the “characteristic or average” DE students (e.g., DE students are generally older, employed, pay their own tuition, and computer skilled), as compared to “characteristic or average” students studying in traditional F2F environments; and finally, a comparison of factors affecting instructional efficacy and student learning in both situations. Many studies have researched various factors pertaining to DE, but as yet there is no comprehensive answer to these questions. Indeed, educational research often produces contradictory results. Differences among studies in treatments, settings, measurement instruments, and research methods, make research findings difficult to compare and may even obscure existing trends (Bangert-Drowns and Rudner, 1991).
The purpose of this study was to research and provide an answer to the question of “quality” of DE programs: “Is there a difference in the quality of learning outcomes of DE programs compared to traditional F2F programs?” In order to examine the issue in its totality, a meta-analytical approach was adopted to synthesize various research studies in this field, and to examine differences between the two methods of delivery.
Distance education’s origins may be traced to nineteenth century in England and continental Europe when colleges used postal services for providing education by means of correspondence (Phipps and Merisotis, 1999; Ponzurick, Russo, and Logar, 2000; Sherry, 1996; Wernet, Olliges, and Delicath, 2000).
The term “distance education” has been used to describe the process of providing education where the instructor is distant (geographically separated) from the student (Gallagher and McCormick, 1999), or any instructional arrangement in which the teacher and learner are geographically separated to an extent that requires communication through media such as print or some other form of technology (Moore and Thompson, 1997, as cited in Spooner, Jordan, Algozzine, and Spooner, 1999; Perraton, 1988; Keegan, 1986; Garrison and Shale, 1987, as cited in Sherry, 1996).
Continued growth of DE has much to do with the advent of radio, television, and other media, which allowed for learning at a distance. This growth accelerated significantly during the 1990s with the use of computer-mediated learning technologies, e.g., two-way interactive video; two-way audio and Web-based asynchronous communication; and online or offline Internet Web-based instruction (Phipps and Merisotis, 1999; Ponzurick et al., 2000; Sherry, 1996; Wernet et al., 2000; Setaro, 2000). Advancements in increasingly flexible technology have enabled the Web’s visual, interactive nature to transform the traditional campus classroom-instructor system into a variety of different and innovative forms of instructional dissemination and to decentralized locations (Hall, 2002; Ponzurick et al., 2000).
A substantial body of research on DE, conducted between 1952 and 1992, showed that DE outcomes were not that different from those achieved in traditional classrooms (DeSantis, 2002). In their review of DE programs, Phipps and Merisotis” (1999) reported:
With few exceptions, the bulk of these writings suggest that the learning outcomes of students using technology at a distance are similar to the learning outcomes of students who participate in conventional classroom instruction. The attitudes and satisfaction of students using distance education also are characterized as generally positive. Most of these studies conclude that, regardless of the technology used, distance education courses compare favorably with classroom-based instruction and enjoy high student satisfaction.
Russell (2002) also examined numerous studies and similarly reported further support of the “no significant difference” phenomenon.
On the other hand, numerous research studies have presented a different picture and therefore conflict with the conclusions cited above, creating a mixed and confusing situation (Dellana, Collins, and West, 2000).
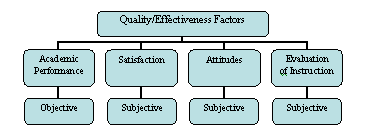
A major concern about DE continues to be its quality compared to traditional classroom education. This concern has spurred extensive research into the factors that affect the quality of these programs. In many cases, “broad” measures of the effectiveness of DE have been examined (as shown in Figure 1).
Figure 1. Quality / Effectiveness Factors
Although student achievement is one common measure of a DE program’s success, it is recommended that program evaluators collect and report additional data to give the most exhaustive description possible.
Additional models of DE effectiveness that have been suggested include the “Flashlight Project” and Aptitude-Treatment Interaction (ATI) studies (Holmberg, 1989; Keegan, 1996; Thorpe, 1988, as cited in Lockee, Burton, and Cross, 1999); and assessment of cognitive and motivational characteristics of learners enrolled in Web-based instruction (Newlin, Wang, and Kosarzycki, 1998, as cited in Lockee et al., 1999). Research on DE effectiveness has focused on four domains: 1) student attitude and satisfaction regarding delivery of coursework; 2) interactions of students and faculty during delivery of coursework; 3) student outcomes in DE coursework; and 4) faculty satisfaction with delivery and coursework (Gallagher and McCormick, 1999). Additionally, Spooner et al. (1999) have analyzed many studies based on such comparative factors as: 1) cognitive factors, namely amount of learning, academic performance, achievement, and examination and assignment grades; and 2) other factors namely, student satisfaction, comfort, convenience, and communication with instructor, interaction and collaboration between students, independence, and perceptions of effectiveness.
Recent meta-analysis studies have focused on specific characteristics in DE: student satisfaction (Allen, Bourhis, Burrell, and Mabry, 2002); instructional features affecting learner achievement (Machtmes and Asher, 2000); and education technologies in K-12 learning (Cavanaugh, 2001).
Measurement of such factors may be divided into two methods:
The literature search findings on one hand, and this study’s intent and purpose on the other, coincide in the direction of providing a comprehensive response to the following research question (RQ) focusing on the objective dimension of effectiveness pertaining to the quality of DE programs, in general, for the 1990-2002 period, and for the final academic performance dependant variable, in particular:
Is there a difference in the final academic performance of students enrolled in DE programs as compared to those enrolled in traditional F2F programs?
The hypotheses was derived from all the aforementioned:
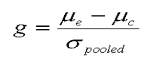
To synthesize the various studies, the statistical technique called “meta-analysis” has been implemented in this study. As there is more than one method of performing a meta-analysis and calculating individual and aggregate effect-size, it is important to explain briefly the concept and rationale behind this technique in general, and how, in particular, it is implemented in this study.
With respect to meta-analysis, there are different approaches to the procedures, computations, and interpretation of results. Three main approaches (Bangert-Drowns and Rudner, 1991) are explained as follows:
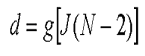
The meta-analytic research type and approach chosen and implemented for this study was a combination of the ‘Study-Effect” and “Psychometric” methods. The parameters for this study are as follows: 1) Inclusion rules were more selective. Studies with serious methodological flaws were excluded. 2) The study is the unit of analysis. One effect size was computed for each study. 3) Effect sizes are of separate and independent studies. 4) Hunter and Schmidt‘s (1990) corrections for sampling error, measurement error, range restriction, and other systematic artifacts were applied to the distribution of effect sizes. 5) Effect sizes were examined within each stratum and across all of the studies/ strata.
Glass, McGraw, and Smith (1981) suggest procedures for conducting a meta-analysis that require a reviewer to complete the following steps: conduct a literature research to collect studies; code characteristics of studies; calculate effect sizes as common measures of study outcomes; and search for relationships between study features and study outcomes. These broad requirements and the methodological steps followed in this study are explained below.
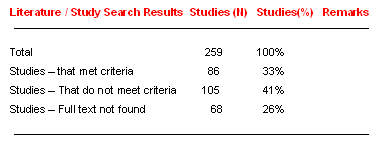
Of the 259 studies aggregated within the database, 86 met all relevant criteria and therefore were included in this study. The data extraction and analysis from these works produced 86 calculated effect sizes, which yielded the final academic performance factor. These 86 effect sizes were the “basis” for the meta-analysis iterations conducted to answer the study’s research question:
The central research question for this study was: “Is there a difference in the Final Academic Performance of students enrolled in DE programs compared to those enrolled in traditional F2F programs?”
The Results of This Study Were as Follows:
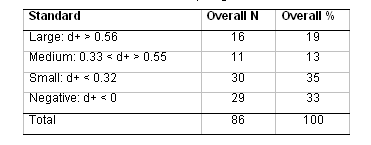
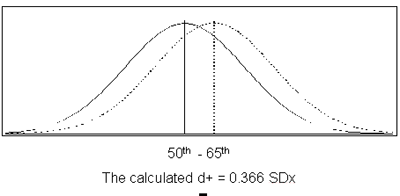
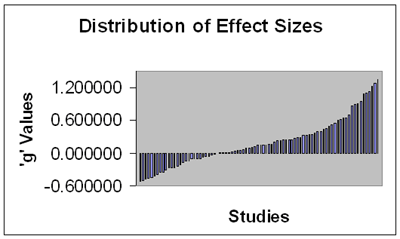
To facilitate review and discussion, all previous findings for the research question were aggregated and consolidated within Table 2. Of the 86 qualifying studies, over two-thirds were positive, denoting that DE out-performed F2F. The overall effect size calculated was positive in direction, and, by Lipsey’s (1990) standards, the overall effect size (d+ = 0.366) was of a medium magnitude.
The overall effect size of 0.366 calculated from 86 studies and testing for Chi Square of 397 brought us to the conclusion that our null hypothesis defined as: “there is no difference between DE and F2F instruction for the final academic performance factor,” should be rejected in favor of our alternative hypothesis.
Table 2. Summary of Study Results
Based on 86 studies and using learning outcome data from over 15,000 participating students, the results of the meta-analysis show a strong positive trend indicating that DE is an effective form of instruction. This analysis demonstrates that students engaged in DE academically outperform their F2F counterparts. We have been focusing all along on the question: “Is DE suitable for all students?” The results of this study may raise the inverse question: “Is F2F suitable for all students?” and may begin a paradigm shift in the way postsecondary education is pedagogically conceptualized.
Examining and reducing bias is of major concern to any researcher implementing meta-analysis procedures. Homogeneity and bias analysis have been the focus of many statistical discussions, and are worthy and deserving of specific attention in this discussion.
Since all individual trials will show chance variation in their results, we need to explore whether the differences presenting in this study are larger than those caused by chance alone. If a series of independent studies provide a common (homogenous) estimate of the population effect size, then it is more likely that the various studies are testing the same hypothesis. If these estimates are heterogeneous, then the question of whether each study is testing the same hypothesis arises.
Heterogeneity provides a warning that it may not be appropriate to combine and synthesize all the study results in one meta-analysis (Wolf, 1986). Debate among statisticians continues as to how to minimize those studies affecting the homogeneity of the research. Hedges (1982) and Hunter, Schmidt, and Jackson (1982) suggest that it is inappropriate to include them in one meta-analysis. Harris and Rosenthal (1985) argue that heterogeneity is analogous to individual differences among subjects within single studies, and is common whenever many studies by different investigators using different methods are examined. Hedges (Becker and Hedges, 1984) admitted that: “It is not necessarily inadvisable to draw inferences from heterogeneous effects.”
The bottom line is that the more refined the research, and the more acute the coding of the individual study’s characteristics, and the less likely that heterogeneous studies will be accepted. This study has adopted and followed a conservative approach throughout all of the meta-analysis procedures. Therefore, even though the final results produce a significant Q (non-combinability) statistic, it is strongly contended that the well defined scope of the study and the narrow and acute extraction of specific data pertaining to a defined dependent variable, override the need for the reduction of supposedly suspicious, outlier studies.
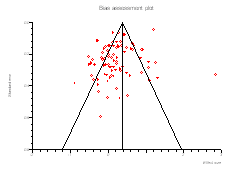
Publication bias arises when trials with statistically significant results are more likely to be published and cited, and are preferentially published in English language journals (Jüni et al., 2001). In this study a systematic approach – the usage and presentation of Bias Plots (where lateral asymmetry indicates bias), and the calculation of Fail Safe N numbers, was taken to identify the possibility of publication bias.
Examination of the bias indicators and plots for our research question shows that we have a small sample bias for the overall meta-analysis. Assessing this bias from the “half-full glass” perspective, had the studies that were analyzed been more robust in their student sample sizes, the bias would have been reduced and we would be even more confident in our current positive findings and results.
The “file drawer problem” (Rosenthal, 1979) refers to the question: How many studies that did not find significant effects have not been published? In other words, if those studies in the file drawer had been published, then the effect sizes for those treatments would be smaller. Therefore, the Fail Safe N is the number of non-significant studies that would be necessary to reduce the effect size to a non-significant value.
In this study the NFS numbers were calculated based on Orwin’s (1983) formula, providing large numbers for our research questions sample sizes. When dc = 0.01 was taken as our criterion value, it was found that about 3,062 additional unreported studies averaging a “null” result would be needed, to nullify our overall d+ average. It is unlikely that there were that many well constructed studies sitting in file drawers.
Distance education literature and research have revolved around three main issues: 1) differences in study formats; 2) variety of technologies; and 3) quality of instruction. Unfortunately, the plethora of information and the diversity of its presentation have obscured some significant findings. First, the differences among studies in terms of treatment, setting, measurement instruments, and research methods have made findings difficult to compare. These differences are so extensive that they obscure trends with an overwhelming amount of information (Bangert-Drowns and Rudner, 1991). Second, an emphasis on the technical aspects of overcoming the distance factor in DE has distracted the discussion from the efficacy of the education itself. The methods of overcoming the geographic distance, which separates instructor from student, vary widely (Gallagher and McCormick, 1999). Methods take the form of computer-mediated learning, two-way interactive video, Web-based asynchronous communication, and on and offline Internet Web-based instruction (Ponzurick et al., 2000; Phipps and Merisotis, 1999). Third, studies of individual DE courses generally conclude that the learning outcomes are not that different from those found in traditional F2F classroom formats (DeSantis, 2002; Phipps and Merisotis, 1999; Russell, 2002).
The meta-analysis approach, methodology, and findings of this study, specifically address these three issues. Since this study provided a positive result for the final academic performance dependent variable, we can deduce that DE not only is comparable to traditional instruction, but also, when subject to our criteria, can outperform traditional instruction. It is important to note that this deduction is further supported by the preliminary results of an ongoing meta-analytic study comparing DE to traditional classroom instruction (Bernard, Lou, Abrami, Wozney, and Borokhovski, et al., 2003). Also, this study did not differentiate between the educational delivery methods of time (synchronous and asynchronous) and place (same and different) dimensions, as categorized by O’Malley and McCraw (1999), or the various technological and tele-communication delivery systems, but rather remained with the general dichotomy of DE courses vs. traditional courses.
Most education researchers accept that if it could be shown that making a small and inexpensive change would raise academic achievement by an effect size of even as little as 0.1, then this could be a significant improvement (Coe, 2000). Even a 0.50 standard deviation improvement in achievement scores is considered to be a conventional measure of practical significance (Rossi and Wright, 1977). A one-third (0.33sd), but at times as small as one-fourth (0.25sd), standard deviation improvement will also be considered to be educationally significant (Tallmadge, 1977). Therefore, the overall effect size d+ = 0.366 found in this study, defined by Lipsey’s (1990) standard as a sound “medium,” denotes that average students in the DE group would find themselves in the 65th percentile of the traditional control group: an educational incremental achievement, at least.
The purpose of this work was to research and provide an answer to the “quality question” of distance-learning programs. Specifically: Is there a difference in the quality of DE programs relative to traditional F2F programs? Providing an answer to this question would serve the multi-faceted fields of education, teaching, training, and learning. Such information would be a supporting construct to the decision makers in academic, business, and professional organizations contemplating the various options for training and development.
These findings provide a definite and positive answer to the DE versus F2F conundrum. This study serves a variety of functions: a) it may serve future researchers in this field, in that this meta-analysis synthesizes a wide body of academic comparative studies of DE vs. F2F; b) with respect to quality of DE programs, it provides concrete findings based on a robust compilation of research studies across various subjects of learning and across all levels of higher education as to the quality of DE Programs; and c) by adopting a meta-analytic approach, it provides a comprehensive answer.
If we argued that DE has yet to be compared to F2F programs provided by the traditional brick and mortar institutions, then the implication of this study’s results should be to accept DE as a respectable and feasible option for education. The findings have implications for changes in each of the following entities:
Academic Institutions and Policy Makers: Educational institutions (mostly in the higher levels of academia) have adopted these new DE methods as the educational delivery systems of the future. We have seen the insertion of DE delivery methods into learning programs in a variety of formats: optional, complementary, interchangeable, or full and completely on-line programs. It is doubtful, however, that we will see materialization of some experts’ predictions of the disappearance of the residential based model in the near future (Blustain et al., 1999; Drucker, 1997 as cited in O’Malley and McCraw, 1999). Rather, these institutions should be encouraged to invest in DE technology, implement DE learning programs, and transform some existing F2F courses to DE so that a wider range of students, regardless of age or geographic location, may enroll in quality learning programs. The realistic possibility of hybrid programs, providing the student with the best of both worlds, may likewise be enhanced.
Organizations: This study may encourage organizations to enhance their in-house professional and managerial training and development programs by combining the power of the Internet and other telecommunication options to create the “information society” characterized by the emergence of the “knowledge worker” (Drucker, 1989). The case for what Dessler (1997) and Mondy, Noe, and Premeaux (1999) refer to as in-house training and development programs that are provided by numerous colleges and universities, can be strengthened by the supporting evidence of this study.
Students: When offered the option of DE as a means of pursuing their academic quest, students can now choose solely on the merits and quality of the program offered, without fear that DE may hinder their academic performance outcomes. For those prepared to commit themselves to this form of study, need not wonder if the DE option of learning anywhere, anytime and at any-pace, is any good. This study may provide positive reassurance, subject to their serious assessment of their specific field of study.
Allen, M., Bourhis, J., Burrell, N., and Mabry, E. (2002). Comparing Student Satisfaction with Distance Education to Traditional Classrooms in Higher Education: A meta-analysis. The American Journal of Distance Education, 16, 83 – 97.
Bangert-Drowns, R. L., and Rudner, L. M. (1991). Meta-Analysis in Educational Research. ERIC Digest. ERIC Clearinghouse on Tests Measurement and Evaluation: Washington, DC. ED 339 48.
Becker, B. J., and Hedges L.V. (1984). Meta-analysis of cognitive gender differences: A comment on an analysis by Rosenthal and Rubin. Journal of Educational Psychology 76, 583 – 587.
Becker, L. A. (1998). Meta-analysis. Retrieved July 20, 2003, from: http://web.uccs.edu/lbecker/Psy590/es.htm
Bernard, R. M., Lou, Y., Abrami, P.C., Wozney, L., Borokhovski, E., Wallet, P. A., et al. (2003). How does distance education compare to classroom instruction? A meta-analysis of the empirical literature. Presented as a Symposium at the 2003 Annual Meeting of The American Educational Research Association, Chicago, IL.
Blustain, H., Goldstein, P., and Lozier, G. (1999). Assessing the New Competitive Landscape. In Richard N. Katz and Associates (Eds.) Dancing with the Devil. San Francisco: Jossey-Bass.
Buchan, I. E. (2000). The Development of a Statistical Computer Software Resource for Medical Research. Doctorate Thesis. University of Liverpool: Liverpool, UK.
Cavanaugh, C. S. (2001). The Effectiveness of Interactive Distance Education Technologies in K-12 Learning: A meta-analysis. International Journal of Educational Telecommunications, 7(1), 73 – 88.
Coe, R. (2000). What is an “Effect Size”? A brief introduction. CEM Centre: Durham University: UK.
Cook, C., Heath, F., and Thompson, R. (2000). A meta-analysis of response rates in Web- or Internet-based surveys; Educational and Psychological Measurement 60,(6), 821.
Dellana, S., Collins, W., and West, D. (2000). Online education in a management science course – effectiveness and performance factors. Journal of Education for Business, 76, 43 – 48.
DerSimonian, R., and Laird, N. (1986). Meta-analysis in Clinical Trials. Controlled Clinical Trials 7, 177 – 188.
DeSantis, C. (2002). eLearners.com. Retrieved November 2, 2002, from: http://elearners.com/
Dessler, G. (1997). Human Resource Management (7th Ed). Prentice Hall.
Drucker, P. (1989). The new realities. New York: Harper and Row.
Egger, M., Smith, D., and Phillips, A. (1997). Meta-analysis Principles and procedures: Education and debate. BMJ.com, 7121, 315.
Fleiss, J. L., and Gross, A. J. (1991). Meta-analysis in epidemiology, with special reference to studies of the association between exposure to environmental tobacco smoke and lung cancer: A critique. Journal of Clinical Epidemiology, 44, 127 – 139.
Gallagher, P., and McCormick, K. (1999). Student satisfaction with two-way interactive distance education for delivery of early childhood special education coursework. Journal of Special Education Technology 14(1) 32 – 47.
Garrison, D. R., and Shale, D. (1987). Mapping the boundaries of distance education: Problems in defining the field. American Journal of Distance Education, 1(1), 7 – 13.
Glass, G. V., McGraw, B., and Smith, M. L. (1981). Meta-analysis in social research. Beverly Hills, CA.: Sage Publications.
Hall, B. (2002). FAQs About E-Learning. Brandon-Hall.com. Retrieved November 2, 2002 from: http://www.brandon-hall.com/
Harris, M. J., and Rosenthal, R. (1985). Mediation of Interpersonal Expectancy Effects: 31 meta-analyses. Psychological bulletin 97, 363 – 386.
Heberlein, T., and Baumgartner, R. (1978). Factors Affecting Response Rates to Mailed Questionnaires: A quantitative analysis of the published literature. American Sociological Review, 43, 447 – 462.
Hedges L., and Olkin, I. (1985). Statistical methods for meta-analysis. London: Academic Press.
Hedges, L. (1982). Estimation of effect size from a series of independent experiments. Psychological bulletin 92, 490 – 499.
Holmberg, B. (1989). Theory and practice of distance education. London: Routledge.
Hunter, J. E., and Schmidt, F. L. (1990). Methods of Meta-Analysis: Correcting error and bias in research findings. Newbury Park, CA.: Sage.
Hunter, J. E., Schmidt, F. L., and Jackson, G. B. (1982). Meta-analysis: Cumulating research findings across studies. Beverly Hills; CA.: Sage.
Jüni, P., Holenstein, F., Sterne, J., Bartlett, C., and Egger, M. (2001). Direction and impact of language bias in meta-analyses of controlled trials: empirical study. International Journal of Epidemiology, 31, 115 – 123.
Keegan, D. (1986). The foundations of distance education. London: Croom Helm.
Keegan, D. (1996). Foundations of distance education. (3rd Ed.). London: Routledge.
Lemura, L., Von-Duvillard, S., and Mookerjee, S. (2000). The effects of physical training of functional capacity in adults: Ages 46 to 90: A meta-analysis; Journal of Sports Medicine and Physical Fitness Training 40(1), 1 – 10.
Lipsey, M. W. (1990). Design Sensitivity: Statistical power for experimental research. Newbury Park, CA.: Sage.
Lockee, B., Burton, J., and Cross, L. (1999). No Comparison: Distance education finds a new use for “no significant difference.” Educational Technology, Research and Development, 47(3), 33 – 43.
Machtmes, K., and Asher, J. W. (2000). A meta-analysis of the effectiveness of telecourses in distance education. The American Journal of Distance Education, 14(1), 27 – 46.
Mondy, R. W., Noe, R. M., and Premeaux, S. R. (1999). Human Resource Management ( 7th Ed.) Prentice Hall.
Moore, M. G., and Thompson, M. M. (1997). The effects of distance education (Rev. ed.). ACSDE Research Monograph, 15. The Pennsylvania State University, PA.: American Center for the Study of Distance Education.
Newlin, M., Wang, A., and Kosarzycki, M. (1998). Who succeeds in Web-courses? Paper presented at the meeting of 1998 EDUCOM, Orlando, FL.
O’Malley, J., and McCraw, H. (1999). Students Perceptions of Distance Education, Online Learning, and the Traditional Classroom. Online Journal of Distance education Administration, 2(4). Retrieved September 19, 2003 from: http://www.westga.edu/~distance/omalley24.html
Orwin, R. G. (1983). A fail safe N for effect size in meta-analysis. Journal for Educational Statistics, 8, 157 – 159.
Perraton, H. (1988). A theory for distance education. In D. Sewart, D. Keegan and B. Holmberg (Eds.) Distance education: International perspectives (p. 34-45). New York: Routledge.
Phipps, R., and Merisotis, J. (1999). What’s the Difference? A review of Contemporary Research on the Effectiveness of Distance education in Higher Education. The institute for Higher Education policy.
Ponzurick, T., Russo France, K., and Logar, C. (2000). Delivering Graduate Marketing Education: An analysis of face-to-face versus distance education. Journal of Marketing Education 22(3), 180 – 187.
Rosenthal, R. (1979). The “file drawer” problem and tolerance for null results. Psychological Bulletin 86, 638 – 641.
Rossi, P., and Wright, S. (1977). Evaluation research; an assessment of theory, practice, and politics. Evaluation Quarterly 1, 5 – 52.
Russell, T. (2002). “The No Significant Difference Phenomenon” as reported in 355 research reports, summaries and papers – a comprehensive research bibliography on technology for distance education. Retrieved July 20, 2003 from: http://teleeducation.nb.ca/nosignificantdifference/
Sahai, H., and Kurshid, A. (1996). Statistics in epidemiology: methods techniques and applications. CRC Press.
Setaro, J. (2000). How E-Learning Can Increase ROI for Training. learning.thinq.com website. Retrieved July 20, 2003 from: http://www.learning.thinq.com/
Sherry, L. (1996). Issues in Distance education. International Journal of Educational Telecommunications, 1(4), 337 – 365.
Spooner, F., Jordan, L., Algozzine, B., and Spooner, M. (1999). Student ratings of instruction in distance education and on-campus classes. The Journal of Educational Research 92(3), 132 – 140.
StatsDirect Ltd. (2002). StatsDirect statistical software. England. Retrieved September 9, 2002 from: www.statsdirect.com
Sterne, J. and Egger, M. (2001). Funnel Plots for Detecting Bias in Meta-analysis: Guidelines on choice of axis. Journal of Clinical Epidemiology 2001;54, 1046 – 1055.
Tallmadge, G. K. (1977). The joint dissemination review panel idea book. Washington, DC.: National Institute of Education, and the US Office of Education.
Thorpe, M. (1988). Evaluating Open and Distance education. Essex, UK: Longman.
Wernet, S., Olliges, R., and Delicath, T. (2000). Post-course evaluations of WebCT (Web course tools) classes by social work students. Research on Social Work Practice, 10(4), 487 – 503.
Westwood, R. (2001). Developing an E-Learning Strategy for Your Organization. PeopleTalk Magazine. BC Human Resources Management Association.
Wolf, F. M. (1986). Meta-Analysis : Quantitative Methods for Research Synthesis. In Quantitative Applications in the Social Sciences, Vol 59. London: Sage Publications.
Yu, C. (2001). Meta-analysis and effect size. Retrieved July 20, 2003 from: http://seamonkey.ed.asu.edu/~alex/teaching/WBI/es.html