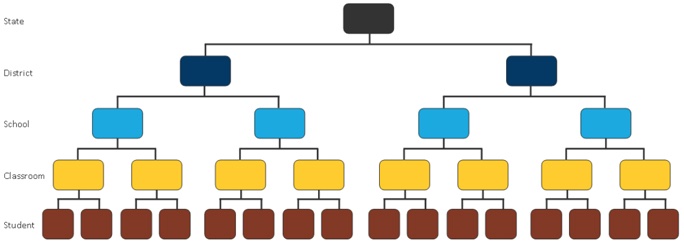
Figure 2. MLM illustration.
Volume 18, Number 4
Jessie Winitzky-Stephens and Jason Pickavance
Salt Lake Community College
Salt Lake Community College (SLCC) is Utah's largest open enrollment college, and as an institution, is concerned about the expense associated with attaining a degree. All students face challenges in paying for their education, but SLCC students tend to have fewer resources to dedicate to school than students at other institutions in the state. While faculty and administrators have little control over the rising cost of tuition, they are able to offer students open educational resources (OER) to cut down on textbook costs. Salt Lake Community College's OER initiative was implemented in Summer 2014, and has since expanded to include 125 sections in Spring 2016. We examine OER's impact on three measures of student success: course grade, likelihood of passing, and likelihood of withdrawing. We use a multilevel modeling (MLM) approach in order to control for student, instructor, and course effects, and found no difference between courses using OER and traditional textbooks for continuing students. For new students, there is evidence that OER increases average grade. However, student-level differences such as demographic background and educational experience have a far greater impact on course grade and likelihood of passing or withdrawing than an instructor's use of an OER text. Future research should focus on longer-term impacts of OER on retention, completion, and transfer.
Keywords: open educational resources, textbooks, multilevel modeling, post-secondary education
The Salt Lake Community College (SLCC) open educational resource (OER) initiative began approximately three years ago with the pilot of two Math courses using MyOpenMath. The work was supported by Project Kaleidoscope, a Next-Generation Learning Challenge grant-funded project aimed at developing OER-based general education courses. Since then, the initiative has grown from its humble beginnings of a few pilots across a handful of disciplines, to one of the most robust educational initiatives at the College. In the Spring 2016 semester, we ran 200 OER-based courses. In the Fall 2016 semester, we jumped up to 569 OER sections, and we have over 600 scheduled for the Spring 2017 semester. Our numbers make us one of the largest single-college OER initiatives in the country. Because these OER courses represent relatively durable commitments to open content in high-enrollment general education areas, we anticipate our numbers holding steady in the coming academic years.
Much of the recent attention on OER has been focused on open degree pathways or so-called Z-degrees (Tepe, 2015). Colleges like Tidewater Community College that have built entirely open degree pathways have, indeed, achieved something significant. However, SLCC intentionally adopted a different strategy. Instead of developing OER vertically (a degree), they decided to develop OER horizontally by flipping entire gateway and general education courses open. The goal was to cast a wide OER net across many 1000-level courses. The strategy has worked. OER is now an almost inescapable reality for any transfer student at SLCC. Courses built around open content represent well over half of the available sections in what is known as our general education core of English, Math, and American Institutions (mandated by the Utah System of Higher Education). These are requirements all transfer students must fulfill, and unlike the general education distribution areas, students have fewer choices in how they fulfill these requirements. Courses like History 1700: U.S. History (our most popular American Institutions course) are completely open. Over half of English 1010: Intro to Writing and English 2010: Intermediate Writing are open. And Math 1030: Quantitative Reasoning (one of the most popular general education math course for non-STEM majors) is also completely open.
Community colleges are ideal environments for OER because open content is so consistent with the community college mission of open access education. Indeed, community colleges are the original open education. The current paper represents the first systematic attempt to understand immediate student outcomes of SLCC's OER initiative. Because the scope of this initiative is so broad, we are able to make a significant contribution to the understanding of OER's overall impact.
There is a paucity of empirical research to undergird the hopeful claims of OER champions. As noted by Hilton (2016), only nine studies examining the effect of OER on student learning outcomes had been published as of his writing. Of the seven that reported statistical significance, six reported no difference or favored OER. While this lends some evidence in support of the use of OER, many of the studies lack statistical rigor. As research into OER is in its infancy, this is to be expected.
To date, only two studies have utilized randomization in their research designs. Lovett, Meyer, and Thille (2008) compared the Open Learning Initiative (OLI) statistics course at Carnegie Mellon University with the traditional face-to-face lecture course. The OLI course operated under an accelerated model, with students expected to complete all modules within eight weeks. It included not only an open textbook, but an entire online course packaged with lectures, homework, and assessments. Students had the opportunity to meet with an instructor twice weekly to ask questions and work through problems. In this way, OLI blended online instruction with face-to-face instruction in a hybrid format. Of 68 volunteers, 22 were randomly placed into the OLI course, while the remaining students took the traditional statistics course. The study found students in the accelerated OLI course "experienced a much more effective and efficient learning experience in that they showed equal or better learning gain in half the time" (Lovett, Meyer, & Thille 2008, p. 14; emphasis in original).
Bowen, Chingos, Lack, and Nygren (2014) expanded the analysis to six higher education institutions. They replicated the method used by Lovett et al. (2008) and randomized 605 participants into either a traditional statistics course or the hybrid OLI course. They were also able to include student-level controls for demographic and educational background. They found no significant difference between these treatment and control groups.
While the two studies to utilize randomization are important, it is worth noting that they examined student performance in a hybrid OER course, as compared to a traditional course employing a commercial text. Whatever differences were observed may be the result of instructional modality, rather than the OER textbook per se.
Feldstein et al. (2012) compared the pass/fail rate in OER and traditional courses and found no difference. However, all sections of each course were either OER or traditional, so no direct comparison could be made. In addition, no student- or instructor-level controls were included to account for individual variation.
Hilton and Laman (2012) performed a similar analysis, but were able to account for the effect of the course itself and that of the instructor. They did this by including data from the same instructors from the previous semester, before OER was implemented. The results strongly favored OER: average course grades and final exam scores were higher in OER sections, and students were less likely to drop. However, significance was not discussed, so we have no way of knowing if these differences are causal or if they simply represent random variation.
Fischer, Hilton, Robinson, and Wiley (2015) utilized propensity score matching in an effort to mimic an experimental design. They paired students enrolled in OER courses with students in traditional courses on the basis of age, gender, and ethnicity. Matching on these three demographic characteristics rendered the "treatment" (OER) and "control" (traditional) groups more similar to one another and eliminated some of the variability introduced by students making individual enrollment choices. The authors examined course completion, passing, course grade, and enrollment intensity for 15 courses. Each course had both OER and traditional sections, and the analysis was done for separately for each course. This resulted in 45 distinct regression analyses. In the majority of analyses, the authors found no significant difference between OER and traditional sections. When differences did appear, they tended to favor OER.
Propensity score matching is a powerful technique. However, age, gender, and ethnicity are not the only individual characteristics that may lead to a decision to enroll in an OER versus traditional course. Other demographic variables that may account for these differences are socioeconomic status, parents' education, parental status, and employment status, among others. In addition, educational experience and academic ability are likely important factors to take into account. Thus, matching is not preferable to true randomization, but it is a close approximation.
In the only study identified by Hilton (2016) as controlling for both student and instructor variables, Allen, Guzman-Alvarez, Molinaro, and Larsen (2015) examined the effect of using an OER text in several sections of a chemistry course. Instructors taught at least two sections of the course, assigning some sections the traditional text and some sections the OER text. In this way, the instructor effect could be minimized. To control for differences between students, the researchers administered study-habit and attitude questionnaires. While this was not a true experiment, every effort was made to control for individual variation. The authors found no significant difference in student learning outcomes between OER and traditional sections.
Taken together, these results are promising. It appears that OER can deliver comparable results for students as traditional textbooks, but at no cost. However, more research is needed across multiple contexts to further investigate the connection between the use of OER and student learning. The current study contributes to this literature by applying a rigorous multilevel methodology to a larger sample of students over a longer period of time.
The OER initiative began in earnest at Salt Lake Community College in Summer 2014. As we wanted a comparison group, we pulled course-level data from each semester between Fall 2012 and Spring 2016. Courses were included if at least one section had been taught using an OER text during this period. This resulted in 37 courses over a wide range of general education subjects, each with both traditional and OER sections. Figure 1 lists each of these courses.
| Subject | Course |
| Anthropology | 2281 |
| Art | 1135, 1200, 1210, 1280, 2120 |
| Biology | 1010,1400 |
| Business | 1050 |
| Economics | 2010 |
| Education | 1020 |
| English | 2010 |
| Geography | 1000, 1300, 1400, 1700, 1780, 1800, 2920 |
| History | 1700 |
| Math | 920, 950, 990, 1010, 1030, 1050, 1060, 1100, 1210, 1220, 2010 |
| Political Science | 1100, 2300 |
| Psychology | 1010 |
| Sociology | 1010 |
| Writing | 900 |
Figure 1. Courses included in the dataset.
Every section and every semester of each course is included in the dataset, netting 34,146 enrollments over 11 semesters. We also included background characteristics for each student enrolled in these courses: age, gender, race, new student status, former concurrent status, accumulated credits, and overall GPA at time of enrollment. It should be noted that students will be duplicated in this dataset if they took more than one of the selected courses, or if they retook a single course. Thus, a single row represents not a student, but a course enrollment. There were 23,430 unique student ID numbers in the dataset. This means roughly 30% were duplicates. While this scenario is not ideal from the standpoint of classical regression, the multilevel modelling technique we employ can easily account for this duplication.
While there were no OER courses taught at SLCC prior to Summer 2014, we included these semesters in the analysis because several courses transitioned completely to OER after this point. Thus, for several courses, there would be no traditional course for comparison. After inspecting the data closely, we found there were some slight demographic changes over this time period: the average proportion of men enrolled between Fall 2012 and Spring 2014 was 52%; after this point it was 49%. Similarly, the average proportion of white students declined from 69% to 67%. There was a concomitant increase in the proportion of Hispanic students from 15% to 17%. There was essentially no change in age, overall GPA, or proportion of former concurrent (dual enrollment) students. The differences we observed are small, and we conclude that pre-Summer 2014 is comparable to later semesters.
The data come from institutional sources. Staff from the Office of Institutional Research pulled data from Banner tables during Fall semester 2016. In addition, staff from the Office of Educational Initiatives keep detailed records of which instructors in which sections choose to employ OER in their classrooms.
Because all data were drawn from our in-house student information system (Banner), missing data was rare. The only variable with a significant amount of missing data was GPA. As students in their first semester in college have not had time to accrue a GPA history, nearly all of the missing data in the GPA field is for new students. Missing data accounts for 17% of GPA observations. When we attempted a multiple imputation technique, modeling GPA using demographic characteristics, substantive changes to our main findings resulted. This indicates poor modeling of the missing data, perhaps due to its non-random nature: only and all new students were missing this field. To ameliorate this issue, we divided the dataset into two groups-new and continuing students-and modeled them separately.
This analysis utilizes a multilevel approach. Multilevel modeling (MLM), also known as hierarchical linear modeling, is an extension of regression analysis that enables us to include indicators at different levels of analysis and define the structure of the relationship between variables as hierarchical. For example, a researcher interested in how 5th graders in the United States perform on a standardized test recognizes that performance can be influenced by differences at the individual, classroom, school, district, and state level. Using MLM, they can structure their analysis in such a way that students are nested within classrooms, classrooms are nested within schools, schools are nested within districts, and districts are nested within states (see Figure 2). Multilevel modeling allows us to take into account variation from the micro- to the meso- to the macro-level. For a fuller treatment of this methodology, see Woltman, Feldstain, MacKay, and Rocchi (2012), Gelman and Hill (2007), and Gelman (2006).
Figure 2. MLM illustration.
For the purposes of the current analysis, we have three levels, which are modeled as random effects: student, instructor, and course. At the student level, we can control for demographic characteristics such as age, gender, and race, as well as past performance such as accumulated credits and overall GPA. We also include student as a random effect because each student may enroll in more than one course. The effect of individual instructors can be captured at the next level, along with instructors' choice to assign an OER or traditional text. At the class level, we can control for the effect of individual course, course level (development education, 1000- or 2000-level), and subject (e.g., Math, Writing, English, Biology). Multilevel modeling is an appropriate analytical tool for these data because, though we are not interested in group effects, students are nested within instructors and courses, and thus do not constitute independent observations.
Model assumptions for the MLM methodology mirror those for OLS. First, variables must have a linear relationship, though there are variants of MLM that can deal with nonlinearity. Second, error terms are normally distributed at each level of the model. Third, we assume populations variances are equal. The final assumption for classical regression is that of independent observations. In this, MLM differs slightly, as it is designed to handle situations in which observations are correlated with one another by virtue of their being nested. However, MLM does require errors to be uncorrelated at different levels. Regression diagnostics and postestimation demonstrate the data meet these assumptions. Though residuals were not perfectly normally distributed, Gelman and Hill (2007) argue this methodology is quite robust, and "the normality or otherwise of residuals doesn't affect the parameter estimates in multilevel modes" (p. 46). We use Stata/IC version 14.2 to perform all analyses, using the mixed command for the continuous dependent variable, and melogit for the binary dependent variables.
| Level | Variables |
| Student (Level 1) | Age Gender Race New student Former concurrent Accumulated credits (continuing students) Overall GPA (continuing students) |
| Instructor (Level 2) | OER |
| Course (Level 3) | Course level (Dev Ed., 1000, 2000) Subject (Math, Biology) |
Figure 3. Independent variables included in analysis.
We use three measures of student success: course grade, pass/fail, and withdraw. These are modeled at the student level. Thus, we can understand individual outcomes while taking into account larger factors such as OER use in the classroom. While longer-term consequences of OER, such as completion and transfer, would be illuminating, these data are not available at this early juncture.
Course grade is reported on a standard letter scale, which we converted to numeric ("A"=4, "A-"=3.7, "B+"=3.3, etc.) for ease of analysis. Grades of "W", "I", and "AU" were coded as 0. The pass/fail is a dummy variable, created from course grade. Pass was set equal to 1, and defined as C- or above. As with numeric grade, "W", "I", and "AU" were coded as 0. Finally, withdraw was also constructed as a dummy variable, with "W" observations equal to 1 and all others equal to 0.
Our main independent variable is the use of an OER text in the classroom. This is a dummy variable, coded as 1 if an instructor chose to use OER, and 0 if an instructor used a traditional text.
In order to isolate the effect of OER use on student success, we included several controls. This study contains three levels of analysis. Student, course, and instructor are modeled as random effects. This means all other variables are nested within them. The majority of independent variables are measured at the student level. In order to account for basic demographic differences between students, we included age, gender, and race. Age is an interval variable, so did not require any manipulation. Gender is coded as a dummy variable (1=Male), and race is simplified as white (1) and underrepresented minority (0). We included Hispanic as a dummy variable in some models, but the effect was small. We also attempted to account for student ability by including former concurrent status (dummy). For continuing students, we also controlled for earned credits and overall GPA.
We also felt it was important to control for the level of the course. Developmental education courses (0900-level) were coded as 1; freshman-level (1000) courses were coded as 2; sophomore-level (2000) courses were coded as 3. Finally, we included dummy variables for math and biology courses. These courses tend to pose greater difficulty for students, with lower pass rates and lower average course grades. As the first instructors to employ OER at our institution were math teachers, this could have a strong impact on the perception of OER outcomes.
While our dataset is quite large, encompassing more than 34,000 enrollments over 11 semesters, it is not experimental in design. Figure 4 shows the number of enrollments in each section of each course by semester. While OER started out quite slowly in Summer 2014, it has grown such that the majority of sections of the selected courses are taught using an OER text.
| Semester | Enrollment count | |
| Traditional | OER | |
| Fall 2012 | 3,090 | |
| Spring 2013 | 3,073 | |
| Summer 2013 | 1,600 | |
| Fall 2013 | 3,438 | |
| Spring 2014 | 3,849 | |
| Summer 2014 | 1,416 | 131 |
| Fall 2014 | 3,576 | 226 |
| Spring 2015 | 2,620 | 1,250 |
| Summer 2015 | 855 | 675 |
| Fall 2015 | 1,951 | 2,394 |
| Spring 2016 | 1,070 | 2,912 |
| Overall | 26,538 | 7,588 |
Figure 4. Enrollments included in dataset.
Figures 5 and 6 list the independent and dependent variables used in the analysis, as well as descriptive statistics for each. As we modeled new and continuing students separately, we display these tables separately as well. As a group, continuing students tend to be older, are more likely to be female, white, and former concurrent. They also tend to earn higher grades (2.39 vs. 2.12) and pass at a higher rate (76% vs. 66%).
| Continuing Students | |||||
| Variable | N | Mean | Std. Dev. | Min. | Max. |
| Age | 28,302 | 25.083 | 7.478 | 13 | 82 |
| Male | 28,302 | 0.496 | 0.500 | 0 | 1 |
| White | 27,972 | 0.697 | 0.460 | 0 | 1 |
| Hispanic | 28,302 | 0.161 | 0.367 | 0 | 1 |
| Former concurrent | 28,302 | 0.330 | 0.470 | 0 | 1 |
| GPA | 28,302 | 3.094 | 0.690 | 0.09 | 4 |
| Accumulated credits | 28,289 | 31.622 | 22.575 | 0 | 210.62 |
| OER | 28,302 | 0.228 | 0.419 | 0 | 1 |
| Course level | 27,989 | 1.968 | 0.387 | 1 | 3 |
| MATH | 28,302 | 0.308 | 0.461 | 0 | 1 |
| BIOL | 28,302 | 0.082 | 0.274 | 0 | 1 |
| Grade | 28,278 | 2.385 | 1.492 | 0 | 4 |
| Pass | 26,587 | 0.757 | 0.429 | 0 | 1 |
| W | 28,302 | 0.053 | 0.224 | 0 | 1 |
Figure 5. Table of descriptive statistics - Continuing students.
| New Students | |||||
| Variable | N | Mean | Std. Dev. | Min. | Max. |
| Age | 5,824 | 23.504 | 7.612 | 15 | 80 |
| Male | 5,824 | 0.534 | 0.499 | 0 | 1 |
| White | 5,761 | 0.648 | 0.478 | 0 | 1 |
| Hispanic | 5,824 | 0.172 | 0.378 | 0 | 1 |
| Former concurrent | 5,824 | 0.019 | 0.138 | 0 | 1 |
| OER | 5,824 | 0.197 | 0.397 | 0 | 1 |
| Course level | 5,673 | 1.872 | 0.420 | 1 | 3 |
| MATH | 5,824 | 0.215 | 0.411 | 0 | 1 |
| BIOL | 5,824 | 0.047 | 0.211 | 0 | 1 |
| Grade | 5,817 | 2.108 | 1.605 | 0 | 4 |
| Pass | 5,462 | 0.657 | 0.475 | 0 | 1 |
| W | 5,824 | 0.051 | 0.221 | 0 | 1 |
Figure 6. Table of descriptive statistics - New students.
As can be observed in the table of correlations below, OER is not significantly correlated with the three measures of course success. Instead we see the importance of student-level characteristics such demographic and academic background, as well course-level indicators such as subject.
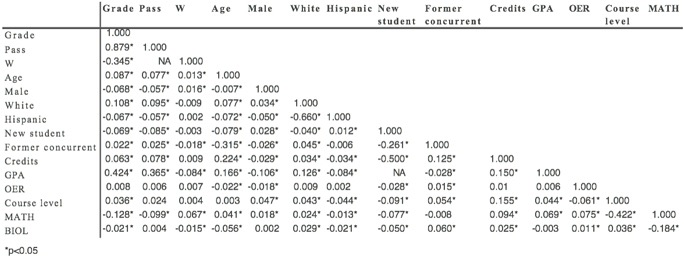
Figure 7. Table of correlations (pairwise).
An initial examination of the data (see Figure 8) uncovers few significant differences between courses employing OER and traditional texts. Overall, OER and non-OER courses are statistically indistinguishable in independent samples t -tests (average course grade) and z -tests for proportions (pass and withdraw rates). However, OER courses had lower pass rates in their first semester of implementation, higher withdraw rates in the second semester, and lower average course grades in the first two semesters. They quickly caught up and are now comparable. In fact, average grades in OER courses were significantly higher than those in their traditional counterparts in Fall 2015.
| Semester | Average grade | Pass rate | Withdraw rate | |||
| Traditional | OER | Traditional | OER | Traditional | OER | |
| Summer 2014 | 2.49 | 1.61** | 71% | 58%** | 7% | 10% |
| Fall 2014 | 2.36 | 2.07** | 74% | 70% | 4% | 8%** |
| Spring 2015 | 2.38 | 2.40 | 74% | 76% | 5% | 6% |
| Summer 2015 | 2.48 | 2.58 | 78% | 81% | 6% | 5% |
| Fall 2015 | 2.27 | 2.40** | 73% | 74% | 5% | 5% |
| Spring 2016 | 2.36 | 2.32 | 72% | 74% | 5% | 6% |
| Overall | 2.37 | 2.36 | 74% | 74% | 5% | 6% |
* p < 0.05
** p < 0.01
Figure 8. Average grade, Pass, and Withdraw rates for traditional and OER courses, Summer 2014-Spring 16.
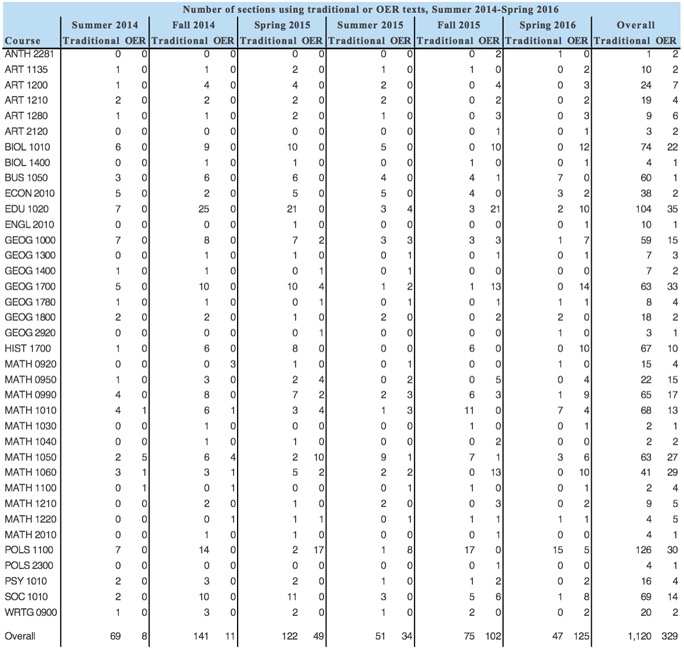
There are several possible explanations for the poorer outcomes in Summer and Fall 2014. It may be the case that the OER initiative was experiencing growing pains, and that it took a few semesters for teachers to adjust their pedagogy to this new instructional resource. Examining the data more closely however, we observed that the only OER subjects on offer at these early stages were math courses (see Appendix). In general, students tend to struggle more in math, and academic outcome measures are typically lower in these courses, as compared to other subjects. The differences we observe may be more a reflection of the difficulty of the course than the effect of OER per se. Because all early OER courses were in math, we were unable to test this hypothesis. Removing math courses and replicating the analysis eliminates the OER comparison group altogether, rendering t- and z-tests impossible.
The confounding effect of subject matter illustrates the need for a model that can take such variation into account. Using MLM, we can control for course subject, course level, the idiosyncrasies of individual instructors, and the background of individual students.
Figures 9 and 10 show the results of multilevel analyses of final grade and logistic MLM analyses of pass and withdraw rates. For continuing students, use of OER is not a significant factor for any of the three dependent variable. Instead, course-level and student-level variables are more important in predicting student success: some 75% of the variability in student success can be attributed to differences between students, and not from instructor or course differences.
As we anticipated, math and biology courses tend to be more difficult. On average, students received lower grades in these courses. In addition, students tended receive lower grades in 1000- and 2000- level courses. Students who were older, white, former concurrent, and had earned fewer credits were more likely to earn a higher grade.
For a student's likelihood of receiving a C- or above, former concurrent status, race, and overall GPA were significant at the student level. The math dummy variable remained important, but the biology dummy lost significance. The direction of the coefficients was consistent for that of numeric grade.
| Level | Variable | Continuing Students Coefficients | ||
| Grade | Pass | Withdraw | ||
| Level 3: Course | Course level MATH BIOL | -0.2402* -0.7637** -0.4250** | -0.4905* -1.3734** -0.6600 | 0.5517** 1.0310** 0.2067 |
| Level 2: Instructor | OER | 0.0218 | 0.0700 | 0.0744 |
| Level 1: Student | Age Former concurrent Male White Overall GPA | 0.0029* 0.0860** 0.0290 0.1820** -0.0009* 0.9245** | 0.0042 0.1132* 0.0329 0.3307** -0.0015 1.7126** | 0.0124** -0.2139** -0.0761 -0.0273 0.0017 -0.6394** |
* p < 0.05
** p < 0.01
Figure 9. Results - Continuing students.
For new students, OER has a slight positive impact of course grade, suggesting OER is of particular importance to first-time college students. Course level and the math dummy variable are significant and negative, as for continuing students. Older students, women, and white students tend to earn higher grades. For likelihood of passing, none of the course- or instructor-level variables are significant. Age, gender, and race remain, and in the same direction as the first model. Finally, men are more likely to withdraw from a course, as are former concurrent students, and those enrolled in higher-level courses (i.e., 1000- and 2000-level).
| Level | Variable | New Students Coefficients | ||
| Grade | Pass | Withdraw | ||
| Level 3: Course | Course level MATH BIOL | -0.2697* -0.2338* -0.1874 | -0.4791 -0.4634 -0.1893 | 0.4566* 0.3796 -0.1561 |
| Level 2: Instructor | OER | 0.1367* | 0.2326 | 0.0482 |
| Level 1: Student | Age Male White | 0.0167** -0.2786 -0.3740** 0.3817** | 0.0435** -0.3758 -0.5924** 0.7522** | 0.0038 0.7359* 0.3120* -0.1366 |
* p < 0.05
** p < 0.01
Figure 10. Results - New students.
Multilevel models examining three measures of student success demonstrated no significant difference between courses using OER and traditional textbooks for continuing students, and a small benefit for new students. Controlling for instructor-, course-, and student-level variables showed individual differences have a far greater impact on students' numeric grade and likelihood of passing or withdrawing than an instructor's use of an OER text.
There is some evidence that OER can be of particular benefit to new students. While it has no effect on likelihood of passing or withdrawing from a course, it is associated with an increase in course grade of 0.1367: small, but not insignificant. It is unclear whether this finding can be attributed to true differences between new and continuing students, or is simply an artifact of insufficient controls. We are able to account for past experiences and abilities of continuing students in the form of accumulated credits and college GPA, but we lack this control for new students. We suspect new students truly do behave differently. For example, a far smaller proportion of new students were former concurrent: 14% vs. 47%.
Nevertheless, we have shown that OER can be implemented in the classroom with no adverse effect on students' grades, or likelihood to pass or withdraw. The cost of a new textbook varies considerably, but the National Association of College Stores (NACS) estimated students spend, on average, $67 for each course material such as a textbook (NACS, 2015). This figure includes new, used, and digital texts, access codes, and custom course packs, so it likely underestimates the cost of required texts for introductory courses. However, at this price point, the 7,588 students enrolled in OER courses at SLCC since Summer 2014 might have spent over $500,000 on textbooks had they taken traditional courses. This represents a tremendous cost savings for students, with no discernible difference in learning outcomes.
The current study, while utilizing a rigorous methodology, was not without its limitations. The goal of any type of regression, including MLM, is to control for confounding variables so as to isolate the effects of the primary independent variable - in our case, the use of OER. Regression is an attempt to mimic an experimental design, which controls for confounding variables naturally by way of randomization. As with any regression analysis, we were unable to account for all of the variation we observed between students. For example, we suspect that a course's delivery modality (i.e., lecture, online, hybrid) might have a strong impact on outcomes, and there might be an interaction between modality and OER. However, information on course modality was not available at the time of analysis.
In addition, as this study was not a true experiment, we were unable to fully control for differences between students. The difficulties we encountered in attempting to model the effects of OER for new and continuing students bear this out. The most powerful tool, given the current data, would combine propensity score matching with MLM. Time constraints did not allow us to pursue such a method.
Finally, while proximate success measures like the ones employed in this study are useful, we are most interested in longer-term student outcomes. The ultimate test of OER is whether it aids students in achieving their educational goals. Are OER students more likely to return the following semester, and the next, until they complete their degree? Does OER free up resources so students are able to take more courses each semester? We do not currently have the tools to perform such an analysis, but we are hopeful that with time, we may be able to build a cohort and understand how OER affects long-term retention, completion, and transfer.
Allen, G., Guzman-Alvarez, A., Molinaro, M., & Larsen, D.S. (2015, January). Assessing the impact and efficacy of the open-access ChemWiki textbook project. Educause Learning Initiative Brief. Retrieved from https://net.educause.edu/ir/library/pdf/elib1501.pdf
Bowen, W.G., Chingos, M.M., Lack, K.A., & Nygren, T.I. (2014). Interactive learning online at public universities: Evidence from a six-campus randomized trial. Journal of Policy Analysis and Management, 33(1), 94-111.
Feldstein, A., Martin, M., Hudson, A., Warren, K., Hilton, J., & Wiley, D. (2012). Open textbooks and increased student access and outcomes. European Journal of Open, Distance and E-Learning.
Fischer, L., Hilton, J., Robinson, T.J., & Wiley, D.A. (2015). A multi-institutional study of the impact of open textbook adoption on the learning outcomes of post-secondary students. Journal of Computing in Higher Education, 27(3), 159-172.
Gelman, A. (2006). Multilevel (hierarchical) modeling: What it can and cannot do. Technometrics, 48(3), 432-435.
Gelman, A., & Hill, J. (2007). Data analysis using regression and multilevel/hierarchical models. New York, NY: Cambridge.
Hilton, J., III. (2016). Open educational resources and college textbook choices: A review of research of efficacy and perceptions. Education Technology Research and Development, 64, 573-590.
Hilton, J., III. & Laman, C. (2012). One college's use of an open psychology textbook. Open Learning, 27(3), 265-272.
Lovett, M., Meyer, O., & Thille, C. (2008). The open learning initiative: Measuring the effectiveness of the OLI statistics course in accelerating student learning. Journal of Interactive Media in Education, 2008(1).
NACS. (2015). Student spending on course materials [Infographic]. Retrieved from https://www.nacs.org/advocacynewsmedia/StudentSpendingInfographics.aspx
Tepe, L. (2015, February). How to get a degree without ever paying for textbooks [Web blog]. http://www.slate.com/blogs/future_tense/2015/02/23/community_college_online_the_promise_of_zero_textbook_cost_degrees.html
Woltman, H., Feldstain, A., MacKay, J.C., & Rocchi, M. (2012). An introduction to hierarchical linear modeling. Tutorials in Quantitative Methods for Psychology, 8(1), 52-69.
![]()

Open Educational Resources and Student Course Outcomes: A Multilevel Analysis by Jessie Winitzky-Stephens and Jason Pickavance is licensed under a Creative Commons Attribution 4.0 International License.