
Volume 17, Number 2
Maina Elizaphan Muuro1, Robert Oboko2, and Waiganjo Peter Wagacha2
Kenyatta University, Kenya 1, University of Nairobi, Kenya 2
In this paper we explore the impact of an intelligent grouping algorithm based on learners’ collaborative competency when compared with (a) instructor based Grade Point Average (GPA) method level and (b) random method, on group outcomes and group collaboration problems in an online collaborative learning environment. An intelligent grouping algorithm has been added in a Learning Management System (LMS) which is capable of forming heterogeneous groups based on learners’ collaborative competency level. True experiment design methodology was deployed to examine whether there is any association between group formation method and group scores, learning experiences and group problems. From the findings, all groups had almost similar mean scores in all group tests, and shared many similar group collaboration problems and learning experiences. However, with the understanding that GPA group formation method involves the instructor, may not be dynamic, and the random method does not guarantee heterogeneity based on learner’s collaboration competence level, instructors are more likely to adopt our intelligent grouping method as the findings show that it has similar results. Furthermore, it provides an added advantage in supporting group formation due to its guarantee on heterogeneity, dynamism, and less instructor involvement.
Keywords: online collaborative learning, intelligent grouping, Learning Management Systems, true experiment design, learner’s collaboration competence level.
Group formation on group work has big impact on group performance. Depending on how the group is formed, it can result in homogeneity in student characteristics and ineffective peer learning. Thus, there is a need to constitute heterogeneous groups in collaborative learning which constitutes students with different collaborative competencies and knowledge levels. However, without empirical study it becomes difficult to conclude which characteristics are desirable in group heterogeneity as different learning needs may require different group orientations. Previous research has focused on various group orientation techniques and their impact on group performance like different learning styles in group orientation (Alfonseca, Carro, Martin, Ortigosa, & Paredes, 2006; Deibel, 2005; Grigoriadou, Papanikolaou, & Gouli, 2006). However, there is need to investigate the impact of other group orientation techniques on group performance like grouping students based on their Collaboration Competence Levels (CCL). Furthermore, most of the previous research in group formation lacks the true experiment design methodology which is recommend when investigating learning outcomes with different instructional methods.
This research sought to investigate the impact of different group orientation techniques (GPA, Intelligent Grouping, and Random) on group outcomes in an online collaborative learning environment. Hence, the research questions we intended to answer in this respect are:
Group formation is the process of identifying students and assigning them to a specific group so that they belong to one specific group when doing a group task (Wessner & Pfister, 2001). In a group task a group can be either homogenous or heterogeneous. In homogeneous group formation a student joins a group with other members who have similar characteristics such as course interests, work schedules and residential proximity. For instance, grouping students with interests in the same academic major or with similar course interests may be an effective procedure for promoting bonding, productivity, and synergy among group members, while grouping students with similar class and work schedules can facilitate out-of-class collaboration among teammates. Also, grouping students with respect to residential proximity may be an effective strategy for enabling group members to get together conveniently outside of class to complete group tasks. On the other hand, in heterogeneous group formation a student joins a group with other members who have different or diverse characteristics such as academic achievement, learning styles, personality profiles and demographic information which could include age, gender, racial, and ethnic or cultural background.
Heterogeneous groups are always preferred because it’s believed they produce constructive controversy (de Faria, Adan-Coello, & Yamanaka, 2006). However, though heterogeneous groups are preferred, there is always are dilemma as to what extent the heterogeneity is in terms of academic achievement, gender, age, social group, and personality. Consequently, numerous studies have been conducted to establish the effect of group formation method on group performance. However, two methods (random selection and self-selection) tend to dominate in the literature, probably due to the fact that there is little involvement of the instructor. However, of these two methods, researchers have posited that self-selection offers the best advantages for students in classroom work groups (Connerley & Mael, 2001; Koppenhaver & Shrader, 2003; Strong & Anderson, 1990).
The criteria for selecting members in a group can also affect the members’ commitment. Group members who choose with whom to work are more relationally satisfied with their group and more committed to work together than members who are randomly assigned to work with each other (Scott, 2001). Random selection method is highly utilized by instructors due to the ease of implementation and “fair” distribution, which gives a student equal chance to be a member of any group, hence both social and academic heterogeneity can somehow be achieved. However, it can also lead to lack of diversity in skills within the group (Bacon, Stewart, & Anderson, 2001). Randomly selected groups have also proven to utilize their time during group meetings more effectively and group members are more task oriented probably because, familiarity among members is less which makes the groups’ social network less compared with self-selected membership (Chapman, Meuter, Toy, & Wright, 2006). Despite these advantages, random selection has proved to be (a) less effective in improving group performance, (b) inferior in group dynamic ratings, and (c) increased conflicts (Chapman et al., 2006). Hence, there is need to explore other intelligent techniques which are more dynamic and are capable of considering collaboration competences among learners.
The use of intelligent systems to do group formation in online collaborative learning environments has also been reported in recent research (Liu, Joy, & Griffiths, 2009; Messeguer, Medina, Royo, Navarro, & Juarez, 2010). Although computer based random selection methods have been preferred in large classes, intelligent techniques are better because they do incorporate learner’s characteristics like learning style (Liu et al., 2009), learner’s profile, and context (Muehlenbrock, 2006) and contextual information (Messeguer et al., 2010). They could also change the group allocation. The ability to change the group member composition in real time enables the leveling up of learning results and improvements in the participants’ social relationships. Some of the intelligent techniques have applied the use of machine learning techniques like instance-based learning and bayesian network which are capable of using contextual information to learn the user behavior and predict an appropriate group for the learner. Liu et al. (2009) and Messeguer et al. (2010) developed an intelligent grouping algorithm based on learning style and integrated it in a LMS to group students with different learning styles together. They also demonstrated its use in a realistic online collaborative learning environment by comparing it with group assignments based on similar learning styles. However, in their study they failed to address the impact of the algorithm when compared to other methods such as random and self-selection (popular in LMS). In addition, there are no true experimental studies on these intelligent systems in order to prove their effect in group performance when compared with instructor-based methods.
Forum data in the Moodle database has many attributes such as a new post which is an original idea, a reply to a post which corresponds to a response to an existing idea, and the average rating of the posts (done by an instructor and indicates the level of relevance of the post on the issues under discussion). Once processed into an appropriate form, these data can be processed by machine learning tools such as Weka clustering algorithms (Aher & Lobo, 2011) and create clusters based on forum data (Aher & Lobo, 2011; Muuro, Wagacha, & Oboko, 2014). In this study we have extracted data from the Moodle database which include: (a) user id (taken from mdl_role_assignments table by checking the role and enroll conditions), (b) number of posts (taken from mdl_forum_posts table), (c) number of replies (taken from mdl_forum_posts table), and (d) forum ratings (taken from mdl_rating table). These data were stored in a .csv text file and were entered into the Weka.PHP program which has the clustering algorithms to create three clusters representing three different collaborative competence levels (High, Medium and Low) as discussed later in Table 1.
Data stored in these clusters were used to form heterogeneous groups using an intelligent grouping algorithm (Muuro, Wagacha, & Oboko, 2014). This grouping algorithm is capable of selecting students from different clusters to form a group which represents diverse collaboration competencies in group membership. To create heterogeneous groups through the intelligent grouping algorithm, first, the data stored in the three collaborative competence levels (Cluster 0, Cluster 1 and Cluster 2) are converted to an array with userid values. Secondly, userids are ranked from Cluster 0 (most collaborative) to Cluster 2 (least collaborative). The result is stored in an array called rankedArray. It’s from the rankedArray that the algorithm picks students from different collaborative levels as per the rank and assigns them to one group as per the specified group size. This process is performed iteratively until all students are assigned to a group. Students who are most collaborative are assigned a mentor role in their group.
The conceptual framework is defined in terms of (a) definition of conceptual elements; (b) relationship between independent, intervening, and dependent variables; and (c) operationalization of the variables.
Independent variables. The independent variables in this study are derived from group formation techniques. Three different group formation techniques are studied, which include: random assignment, Grade Point Average (GPA) and intelligent grouping. These three different group formation techniques are used to construct our independent variables. In random assignment, group members are assigned at random and therefore, random numbers are used as indicators. In GPA method, students’ performance in a given period of time is used as an indicator. In intelligent grouping, collaboration competence level is used as an indicator whereby data mined from a discussion forum are used to cluster students based on their collaboration competence level.
Dependent variables. Our dependent variables are derived from the group outcomes. The group outcomes include the group performance, learning experiences, perceived group problems, group task satisfaction, and group leader satisfaction. These five different group outcomes are used to construct our dependent variables. Performance in group work can be characterized by three characteristics: interdependence, synthesis and independence. Indicators for these group outcomes include: number of new posts or replies in a discussion forum, forum rating scores assigned by an instructor, and scores obtained from a written test or quiz related to the discussion forum. Figure 1 illustrates the relationship between independent and dependent variables.
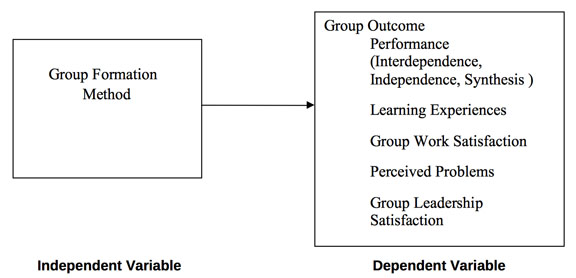
Figure 1. Relationship between independent and dependent variables.
In order to measure collaboration competence level we introduce three collaboration characteristics: interdependence, independence and synthesis. Interdependence requires active participation by each member; participation can be measured by counting the number of messages and statements submitted by each individual and the group to the other participants. This allows both groups and individuals to be compared in their level of participation. Independence, on the other hand, can be analyzed by measuring the extent of influence by the instructor or other participants in individual participation and interaction. Individuals who post new ideas rather than just replies are more independent, hence, more collaborative. Synthesis can be measured in two ways. First, by the interaction pattern of the discussion that occurs when a participant contributes a statement. Another participant synthesizes it by extending the idea and yielding new ideas in subsequent messages. This requires content analysis of the individual thread contributed in the discussion forum. Second, synthesis can be analyzed by examining the relationship between original comments and the final product. In this study, we apply the latter where the instructor compares the post with the final product and assigns a numerical value as per the relevance. This in turn indicates the level of individual contribution in relation to the final product.
In the light of the above arguments, we apply the three attributes to define three collaboration competence levels (High, Medium and Low) which are characterized by different levels of interdependence, synthesis and independence as described in Table 1. Operationalization of variables which are indicated in the conceptual framework is shown in Table 2.
Table 1
Characteristics Associated with Collaboration Competence Levels
| Collaboration Competence Level | Characteristics |
| High | Student logs in often, participates and interacts actively and indicates high level of interdependence, synthesis, and dependence. At this level the learner can be ranked into a higher level of collaboration competence. |
| Medium | Student logs in often, participates and interacts moderately and indicates moderate interdependence, synthesis and dependence. At this level the learner needs assistance to improve to high level. |
| Low | Student logs in and participates rarely and there is no indication of interdependence, synthesis and dependence. At this level, the learner needs immediate attention to improve to medium level. |
Table 2
Operationalization of Variables in Terms of Indicators, Measurements Criteria and Scale
| Variable Type | Main Variable | Sub Variables | Indicators/ Measurement criteria | Values | Scale |
| Independent | Group Formation Method | Student performance (GPA) | Class one | Nominal | |
| Collaboration Competence Level | Class two | ||||
| Random Numbers | Class three | ||||
| Dependent | Group outcomes |
Performance
|
| Scores | Ratio |
| Learning Experiences |
| 5-point Likert scale | Ordinal and interval | ||
| Group Work Satisfaction |
| 5-point Likert scale | Ordinal and interval | ||
| Perceived Problems |
| List of group problems | Ordinal | ||
| Group Leadership Satisfaction |
| 5-point Likert scale | Ordinal and interval |
The students who participated in this study were first-year students who were doing a Bachelor of Science in Computers Science and Bachelor of Science in Mathematics and Computer Science at Kenyatta University, Kenya. First-year students were targeted because senior students have socially interacted more and they do prefer to work through social groups which can skew the experiment results. These students were studying a first year course called Foundations of Artificial Intelligence. This is a course in computer science which has a number of topics like problem solving in a state space which has the potential to elicit some discussion, hence a good course to be done through collaborative learning. The entire population for the first year class was 108 students who had registered for the course by the time the research was being conducted. All the students were picked to participate in the study. Therefore, the sample size was the same as the population.
The 108 students were randomly assigned into three classes with equal numbers (36 students per class). The randomization was done through generating random numbers in an excel worksheet. Randomization was preferred to ensure that participants had an equal probability of being assigned to any class. This also reduces the effect of extraneous variables such as subject characteristics which is major threat to internal validity (Fraenkel, Wallen, & Hyun, 2012).
A true experimental design was adopted where an experimental group and two control groups were used. The control groups played the role of comparison groups as they also received different treatment in terms of group orientation. Experimental design was adopted because it could help to identify the effect of the independent variable (group formation) to the dependent variable (group outcome). The three classes which were formed through randomization as discussed earlier were used in the group design, where one class served as the experimental group and the other two classes as the control groups. Each class was then assigned an instructor who was responsible to teach the course and oversee the discussions throughout the experimental period. The instruction design and teaching materials were prepared before the start of the course by the three instructors. This was to ensure same course materials and instruction design was used throughout in the three classes.
During the third and fourth week, students were given some discussion questions, such that for every week there was group task to be solved. Self-selected groups were used in all three classes during this period of four weeks. The purpose of this discussion was to orient the students on forums in Moodle and at same time to generate discussion data which was to be used in the intelligent grouping. Self-selected grouping method was used because of: (a) known advantages such as allowing students to communicate better, have positive attitude towards group work, and feel more excited to work together (Chapman et al., 2006); and (b) to ensure internal validity as this grouping method was not included in the research question under study. At the end of four weeks of discussion, the students did a pretest which was taken as the first Continuous Assessment Test (CAT). The pretest was also used to confirm whether the randomization method used in creating the three classes was heterogeneous in terms of learning capability.
During the sixth week, students were placed into groups of four using different methods for each class. Group size of four was preferred as this was an average size which was small enough to represent heterogeneous learning characteristics and also to utilize the advantages that are realized when students discuss in groups of small size (Schellenberg, 1959). Students were expected to collaborate online at different times in the same location (same computer lab) using asynchronous communication tools. Each group had a group leader who was expected to initiate the discussion, moderate the discussion and summarize the main points. The following procedures were adopted to assign students into groups and also to assign group leaders to each group:
After the exercise of grouping was over, students were informed of their group assignments, how the rest of the discussion was to be carried out, and how evaluation would be done during the experimental period. Table 3 describes how internal validity was enhanced.
Table 3
Summary of Internal Validity Threats and Measures Taken
| Type of Threat to Internal Validity | Measures taken |
| Subject characteristics | Randomization in assigning participants to groups and test (pretest) was done to measure the effectiveness of the randomization. |
| Location | Same learning environment was used, (i.e., the whole experiment was conducted in Kenyatta University [KU]). |
| Instrumentation | Validation on each instrument was done as described in the respective sections and all tests were conducted at the same time for all the groups. Different groups were used to pretest the instruments rather than the participants. Successfully approved assessment tools in Moodle were used to assess the forums. |
| Testing | Pretest and posttest were different. Pretest was only meant to measure effectiveness of randomization. |
| Attitude of subjects | Students were informed about the purpose of the study at the start of the course and the tests were to be part of the CAT for the course. |
| Implementation | Three different instructors who are experts in the course were used to facilitate teaching of the course in the three classes but the same instructional materials were used throughout. |
The instruments which were used in this study include a pretest, posttests and a poststudy questionnaire. The next section discusses how the instruments were constructed and the measures taken to ensure validity.
Pretest. Thirty multiple choice questions were constructed where the question items were drawn from Artificial Intelligence (AI) books. The topic covered in the pretest was introduction to AI. To ensure the test involved thorough comprehension and critical thinking by the students, multiple choices were closely associated to the right answer for all items. The thirty questions were then added into Moodle as a quiz and each question was assigned 1 mark. The multiple choice questions were reshuffled dynamically by the system to avoid copying of answers among students.
Posttest. The posttest was made up of three tests which were designed differently but the contents were drawn from the same topic. That way, different taxonomies on knowledge construction were examined as recommended in Bloom’s taxonomy (Bloom, 1956). The first section was a discussion forum which required the students to solve state space search problems. State space search problems were preferred because they generate a lot of discussion since there could be multiple solutions depending on the description of the state space and the heuristic function used to generate a solution. It is also possible to set many questions which are of the same weight by simply examining: (a) description of the state space, (b) rules and operators for moving from one state to another, (c) possible solutions, and (d) optimal solution and related heuristic function.
For each class there were nine groups, where group size ranged between 3 and 4. To minimize crossover problems during discussion, nine questions of similar weight were constructed such that each group had its own question, but; the nine questions were replicated in the three classes. The replication had no effect among the classes since each class was assigned a separate lab and the discussion forum was conducted the same time in all the three classes. Discussion forum was preferred because forums are a powerful tool in Moodle which allow course participants to post messages and reply to each other online.
The following assessment tools were used to mark the discussion forum:
Table 4
Summary of Parameters Used to Assign Marks and Assignment Criteria
| Parameter | Database object used in Moodle | Enrichment level check values | Marks/Points awarded | Maximal score |
| Number of occurrences/replies | Log and Forum_posts |
P 1 >=0 P 1 >=1 P 1 >=2 P 1 >=3 |
0 1 2 3 | 3 |
| Number of files submitted into the forum | Forum_posts |
P 2 >=0 P 2 >=1 P 2 >=2 |
0 1 2 | 2 |
| Number of new posts to the forum | Forum_posts |
P 3 >=0 P 3 >=1 P 3 >=2 P 3 >=3 |
0 1 3 5 | 5 |
The second test was given inform of a quiz which consisted of 10 multiple choice questions which were constructed to examine the expected solutions in the discussion forum. This test was meant to measure an individual’s knowledge comprehension and knowledge construction during the discussion forum. The quiz was availed online immediately the discussion forum session was closed. Each student was given a single attempt for each item and was required to finish the 10 questions in the quiz within a period of 30 minutes. The process of marking and assigning scores for this quiz was automated, but students were not informed about their scores at this junction as they had to do another test. This was to avoid poorly scoring students being less motivated in the third test.
The third test was a written test which was constructed to test individual knowledge comprehension through short answers and easy questions. The test had weight of 20 marks and the tested items were based on the discussion forum. The test was administered immediately after the quiz and student were allocated one hour to do the test. Since the test was not meant to test memorization student were allowed to refer to their short notes they had prepared during the discussion session. This ensured that those students who had discussed a lot and arrived to the right solutions had a higher chance of scoring high if they prepared good notes from the discussion. The test was marked later using a marking scheme which was constructed by the three instructors and allocation of marks on each item was also agreed among the three instructors.
Before the posttest was given to the participants the following measures were taken to enhance validity:
The purpose of this questionnaire was to collect data on the students’ experiences on the group task. These students’ experiences were categorized into different categories as summarized in Table 5. Nineteen items in the questionnaire were close ended while three items were open ended. The Google doc. was used to construct the questionnaire, this made it easier to have the questionnaire availed online to the respondents.
Table 5
Description of Poststudy Questionnaire Items in Terms of Type and Information Gathered
| Item Number | Type | Information Gathered |
| Items 1-6 | Multiple choice | Demographic information which included the email address, gender, group, class, frequently used tool to communicate online, previous knowledge on Moodle. |
| Items 7-10 | Multiple choice | Problems experienced when doing group task |
| Item 11 | 5-point Likert scale | Whether the group task helped the individual learner to learn the tested concepts |
| Item 12 | Yes/No | Who was a group leader and non leader |
| Items 13 &15 | 5-point Likert scale | Self-evaluation on how effective the group leader was in leading the group |
| Item 16 | 5-point Likert scale | Whether the group leader played an effective role in leading the group |
| Item 17 | Yes/No | Those who were not comfortable to continue with their group membership and those who were comfortable |
| Item 18 | Short answer | Reasons for the choice provided in number 17 |
| Item 19 | 5-point Likert scale | Collaboration experiences among the members in their group membership |
| Item 20 | Open ended | Students’ best experiences during the group activity |
| Item 21 | Open ended | Students’ worst experiences during the group activity |
| Item 22 | Open ended | Students suggestions on how to improve the online discussion |
Validation of the instrument. To ensure validity, content-related evidence was used and two experts in e-learning were requested to review the content and the format of the questionnaire. Based on their comments some of the items were rephrased, more items were added, some content enriched, and reformatting done as recommended. The questionnaire was also pretested with a group of second year computer science students who were doing a similar course through Moodle. About fifty students were selected and emailed the questionnaires that were completed online. The Cronbach’s coefficient alpha for the 5-point Likert scale items had satisfactory reliability (alpha=0.86; Nunnally, 1978).
Data collection and analysis. The pretest and posttest results were archived in the Moodle database. One-hundred eight students were emailed the final questionnaires that were completed online. A total of 90 students responded (83% response rate) which was considered adequate for analysis. The collected data were exported to SPSS and coded in order to carry out both descriptive and inferential statistics as per the research objectives. Using SPSS, quantitative analysis was carried out and the results were tabulated. To compare the students’ experiences with different group formation methods, cross-tabulations were carried out on various items as per the research questions.
Table 6 shows the mean, minimum (Min), maximum (Max), median and mode for the scores in pretest and posttests respectively. The posttest results are divided into five portions: (a) forum ratings (P1) which was done by the instructor and rated with a maximum score of 10, (b) forum scores (P2) based on the rubric analytic tool where the maximum score was 10 points, (c) multiple choice quiz (P3) where the maximum score was 10 points, (d) short answers questions (P4) where the maximum score was 20 points, and (e) total scores (P5) for all the four posttests giving a maximum score of 50 points.
Table 6
Descriptive Statistics for Pretest and Posttests
| Max Points | N | Mean | Min | Max | Median | Mode | |
| Pretest | 30 | ||||||
| Class One | 36 | 15.5 | 10.0 | 24.5 | 15.1 | 16.0 | |
| Class Two | 33 | 17.4 | 11.5 | 23.5 | 17.3 | 18.0 | |
| Class Three | 35 | 16.1 | 8.5 | 25.8 | 15.6 | 12.0 | |
| Posttest (P1) | 10 | ||||||
| Class One | 33 | 7.6 | 3.0 | 10.0 | 8.5 | 10.0 | |
| Class Two | 33 | 7.3 | 1.0 | 10.0 | 7.0 | 10.0 | |
| Class Three | 34 | 7.8 | 3.0 | 10.0 | 6.0 | 10.0 | |
| Posttest (P2) | 10 | ||||||
| Class One | 33 | 5.6 | 0.0 | 8.0 | 6.5 | 8.0 | |
| Class Two | 33 | 5.1 | 0.0 | 9.0 | 6.0 | 7.0 | |
| Class Three | 34 | 5.4 | 0.0 | 9.0 | 5.5 | 8.0 | |
| Posttest (P3) | 10 | ||||||
| Class One | 34 | 7.5 | 4.3 | 10.0 | 7.3 | 10.0 | |
| Class Two | 31 | 8.2 | 2.8 | 10.0 | 9.0 | 9.5 | |
| Class Three | 32 | 8.1 | 4.8 | 10.0 | 8.8 | 10.0 | |
| Posttest (P4) | 20 | ||||||
| Class One | 33 | 7.1 | 2 | 16 | 6 | 6 | |
| Class Two | 31 | 7.7 | 3 | 17 | 7 | 6 | |
| Class Three | 33 | 8.4 | 2 | 16 | 8 | 10 | |
| Posttest | 50 | ||||||
| Class One | 34 | 27.0 | 9.3 | 43.5 | 28.1 | 26.5 | |
| Class Two | 33 | 27.4 | 3.8 | 42.3 | 27.4 | 29.0 | |
| Class Three | 34 | 28.9 | 13 | 43.3 | 27.6 | 23.0 |
The ANOVA analysis results shown in table 7 indicate that, the Sig. values ( p ) for pretest and posttests were above the alpha value (0.05). Therefore, there was no statisticaly signficant difference in the mean score for all the tests between the three classes.
Table 7
One-Way ANOVA for Pretest and Posttests
| Pretest/30 | Sum of Squares | Df | Mean Square | F | Sig. |
| Between Groups | 61.937 | 2 | 30.968 | 2.825 | .064 |
| Within Groups | 1107.147 | 101 | 10.962 | ||
| Posttest (P1) | |||||
| Between Groups | 4.341 | 2 | 2.17 | 0.314 | .731 |
| Within Groups | 670.299 | 97 | 6.91 | ||
| Posttest (P2) | |||||
| Between Groups | 4.14 | 2 | 2.07 | 0.261 | .771 |
| Within Groups | 769.17 | 97 | 7.93 | ||
| Posttest (P3) | |||||
| Between Groups | 15.8 | 2 | 7.9 | 0.321 | .727 |
| Within Groups | 2390.71 | 97 | 24.646 | ||
| Posttest (P3) | |||||
| Between Groups | 10.243 | 2 | 5.121 | 1.419 | .247 |
| Within Groups | 339.322 | 94 | 3.61 | ||
| Posttest (P4) | |||||
| Between Groups | 28.034 | 2 | 14.017 | 1.15 | .321 |
| Within Groups | 1145.451 | 94 | 12.186 | ||
| Posttest | |||||
| Between Groups | 80.012 | 2 | 40.006 | 0.576 | .564 |
| Within Groups | 6804.163 | 98 | 69.43 | ||
Note. Df = degrees of freedom; F = value to determine whether the results are significantly different; Sig. = the value to be compared with the alpha value (0.05)
Demographic information. A total of 90 students responded out of 108 students who had participated in the study, with class one having 29, class two 29 and class three 32. There was a gap in the gender equity as 75% were male and 17% female. The low percentage for female participants was expected because the study was based on students who were doing computer science course which had few female students enrolled for the course. Table 8 summarizes the demographic data.
Table 8
Demographic Information
| Characteristic | Frequency | Percentage |
| Gender | ||
| Male | 75 | 83% |
| Female | 15 | 17% |
| Class | ||
| Class one | 29 | 32% |
| Class two | 29 | 32% |
| Class three | 32 | 36% |
| Frequent of use on communication tools | ||
| 6 | 7% | |
| SMS | 62 | 69% |
| Social Media | 20 | 22% |
| Phone Calls | 2 | 2% |
| Previous knowledge on how to use Moodle | ||
| Yes | 47 | 52% |
| No | 43 | 48% |
Note. n=90
Problems experienced during the group task. Table 9 summarizes the frequencies of the observed problems in terms of the class mean and the overall mean. Participants who experienced problems in individual contribution imbalance and problems with negotiation skills were fewer in class two than the other two classes. However, as observed from p values there was no statistically significant difference on the problems experienced during the group task between the three classes.
Table 9
Problems Experienced During the Group Task
| Problems experienced during the group task | Mean | ||||
| Overall (n=70) | Class one (n=29) | Class two (n=29) | Class three (n=32) | p value | |
| Lack of participation feedback | .48 | .52 | .48 | .44 | .822 |
| Conflict and problems in reaching consensus in the group exercise | .12 | .14 | .14 | .09 | .829 |
| Individual contribution imbalance with some members contributing less than others | .52 | .66 | .41 | .50 | .175 |
| Problems with negotiation skills such that it was difficult to agree on a common goal | .17 | .24 | .10 | .16 | .363 |
| Lack of coordination from Group Leader | .22 | .10 | .28 | .28 | .174 |
| Posting of irrelevant comments by members | .03 | .00 | .03 | .06 | .397 |
Note. The mean is equivalent to the proportion of yes responses. The p value = significance of difference between class one, class two and class three: * p <0.05
Group outcomes. Table 10 summarizes the group outcomes which include: (a) effectiveness of the group discussion as a learning tool, (b) effectiveness of the group leader, and (c) group task satisfaction.
Table 10
Group Outcomes Mean Values
| Mean | |||||
| Overall (n=70) | Class one (n=29) | Class two (n=29) | Class three (n=32) | p-value | |
| Effectiveness of the group discussion as a learning tool | |||||
| I found it easy to learn through the Discussion Forums in Moodle | 4.04 | 3.9 | 4.07 | 4.16 | 0.629 |
| By reading the contribution of others I had a better understanding of the problem solving concept in AI | 4.04 | 4.07 | 3.83 | 4.22 | 0.155 |
| The participation in Group Activity improved my understanding on the topic under discussion | 4.02 | 3.93 | 4.03 | 4.09 | 0.573 |
| When group members created new post it provided me with a new perspective of the topic in discussion | 3.98 | 3.79 | 3.9 | 4.22 | 0.49 |
| I learnt more about the subject matter under discussion in the group exercise than I would if I worked individually | 3.88 | 3.72 | 3.86 | 4.03 | 0.57 |
| In online discussion forums I learnt more than discussions in other face to face (Lecture) methods | 3.42 | 3.17 | 3.48 | 3.59 | 0.21 |
| Effectiveness of group leader | |||||
| I enjoyed working with my group leader | 3.52 | 3.59 | 3.42 | 3.55 | 0.422 |
| Our group leader coordinated the group exercise well and kept the group on-track- kept the group focused and organized | 3.21 | 3.18 | 3.11 | 3.35 | 0.299 |
| Our group leader demonstrated thorough understanding of the subject content | 3.2 | 3.18 | 3.16 | 3.25 | 0.295 |
| Our group leader managed conflict and differences of opinions within the group task | 3.09 | 2.88 | 3.16 | 3.2 | 0.248 |
| Our group leader summarized the group's discussion and came up with the conclusions | 2.88 | 2.47 | 3 | 3.1 | 0.020* |
| Group task satisfaction | |||||
| I would recommend online discussion forums in future studies in my course work | 4.28 | 4.12 | 4.47 | 4.33 | 0.461 |
| I think all our group members were given fair opportunity to contribute | 4.19 | 3.96 | 4.33 | 4.26 | 0.455 |
| I would recommend for more group activities with my group members | 4 | 3.72 | 4.11 | 4.15 | 0.467 |
| I enjoyed working with my peers in our group activity | 3.99 | 3.71 | 4.11 | 4.11 | 0.467 |
| The group size was optimum for effective discussion | 3.96 | 3.79 | 4.22 | 3.85 | 0.548 |
| In my group activity, members were free to criticize each other contribution in a positive and constructive manner | 3.95 | 3.92 | 4.04 | 3.89 | 0.574 |
| Time allocated was enough to complete the group activity | 3.83 | 3.46 | 4 | 4 | 0.348 |
| In our group activity, I was able to negotiate with my peers and reach to a consensus | 3.76 | 3.75 | 3.78 | 3.74 | 0.739 |
| I was satisfied with the level of contact I had with my peers | 3.6 | 3.5 | 3.56 | 3.74 | 0.086 |
| One or two members dominated the group exercise | 2.76 | 2.96 | 2.81 | 2.52 | 0.792 |
Note. Ratings are based on a 5-point Likert scale where 1 = strongly disagree and 5 = strongly agree. p value = significance of difference between class one, class two and class three: * p <0.05
Experiences during the group task. Through an open ended item, the participants were requested to briefly explain their best and worst experiences they had during the discussion period. The results from best experiences were coded into seven items which are shown in Figure 2 and those for worst experiences were also coded into eight items which are shown in Figure 3. Basically majority of the student reported that learning from peers was a good experience (27%) and it helped them understand the concepts studied (11%). For the worst experiences, slow access to site or slow internet (36%), was a major problem.
Frequency
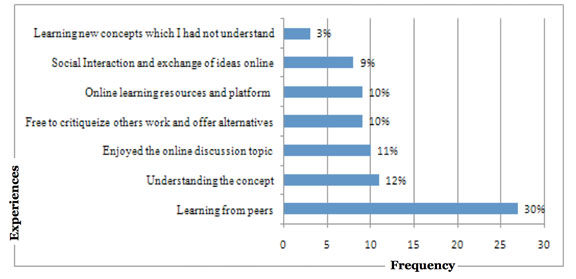
Figure 2. Best learning experiences from the discussion
Frequency
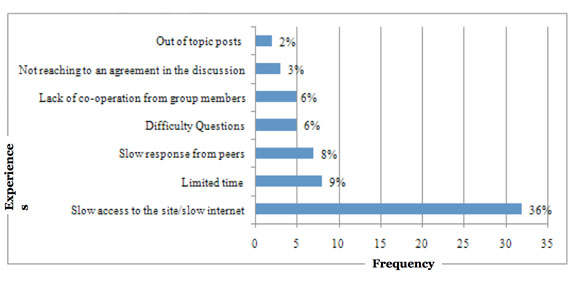
Figure 3. Worst experiences during the discussion
Table 11 presents the common themes that we identified in the students’ perceived benefits in an online collaborative learning environment. For each theme, the table gives a few illustrative comments made by students.
Table 11
Benefits Which Students Cited for Participation in Online Collaborative Group Work
| Theme | Cited Examples |
| Learning from other Peers | It was fantastic moment since I was able to learn a lot from my peers who are doing the same course as me since people who could not contribute on face to face discussion group may be due to lack of confidence and may be didn't know how to express themselves in front of people contributed and it was just surprising to see how they had good ideas which really helped a lot during discussion. having the lecturers summarized notes online made learning easier and peaceful |
| Understanding the concept | I was able to understand the topic under discussion better than when I came in. I experience the most effective way of learning, it built my knowledge on online skills |
| Learning experience was interesting | Discussing the subject matter and giving views. The chance I got to interact with the other members in that platform was really good. It was better than face to face discussions because I could research by myself and post to the group. It was new, enjoyable. I got to learn about AI more than I did individually |
| Social Interaction and exchange of ideas online | During the online discussion, I manage to gain a lot since we were able to openly post. Question and discuss the possible answers in length unlike when we are in class. More so the discussion group minimal enough for effective discussion, furthermore those I did not know I was able to know them better |
We discuss the results of the study based on three research questions.
Which group of learners amongst the intelligently-grouped (class two), randomly-grouped (class three) and instructor-grouped using GPA (class one) performs best in an online collaborative environment task?
From the ANOVA analysis shown in Tables 7 there was no statistical significance difference between the means for all the posttest scores; therefore, there was no statistical significance difference among the classes. This means the effectiveness of intelligent group algorithm is equally the same as the random assignment and GPA instructor based grouping mechanisms. Therefore, the intelligent grouping algorithm was able to generate heterogeneous groups where members have diverse backgrounds including collaboration competencies, learning capabilities and social background similarly to what has been proved in random assignment. However, the method of group formation had a slight effect on the mean scores in all posttest scores. The differences in minimum scores could account for this slight difference in the mean scores. For example, in the quiz, class two had the highest median score (9.0) and the minimum score (2.8). This minimum score could have reduced the mean.
What is the association between grouping method used and group outcomes in terms of: (a) students’ learning experiences, (b) perceived problems, (c) group leadership satisfaction, and (d) group task satisfaction?
Findings from the study indicate that two major problems were experienced: first, an individual contribution imbalance with some members contributing less than others (52%); and second, a lack of participation feedback in all the three classes (48%). This coincides with other studies in which the two major problems do prevail in an online collaborative learning environment (Capdeferro & Romero, 2012; Liu, Joy, & Griffiths, 2010; Muuro, Wagacha, Oboko, & Kihoro, 2014; Roberts & McInnerney, 2007; Zorko, 2009). The mean scores for yes responses were different on the two major problems in the three classes. The GPA assignment method (class one, 66%) had more participants experiencing contribution imbalance than the other participants who were assigned groups through intelligent grouping algorithm (class two, 41%) and random assignment (class three, 50%). This could probably be explained by the fact that GPA method had assigned students to groups based on their academic performance such that for each group there was student with higher GPA. These students with higher GPA could have dominated the discussion because they are more knowledgeable than others causing contribution imbalance. On the other hand, intelligent grouping method had the lowest participants experiencing this problem. This could probably be explained by the fact that this method had grouped students based on their collaboration competence levels such that for each group there was at least one student who had high collaborative competence. These student could have pulled the team together and make members collaborate more evenly with minimal contribution imbalance. However, in regard to these differences no statistically significant relationship found among the three classes in group problems as per the p values (see Table 9).
As observed from Table 10, all the items for evaluating the effectiveness of the discussion forum as a learning tool were positively rated with some having an overall mean value above average in all items. This coincides with other studies for constructivist approach to learning where peer learning has been reported to be more effective on helping learners to interpret, clarify and validate their understanding through constructed dialogue and negation with their peers than individual learning (Garrison, 1993). Furthermore, this also supports the fact that discussion forums do support e-learning by enabling learners to actively construct knowledge by formulating ideas into words that are shared with and built on through the reactions and responses of their peers in the forum (Harasim, Hiltz, Teles, & Turoff, 1995). Although there was a slight mean difference on the learning experiences in the three classes, according to the p values in Table 10 none of the p values was less than 0.05 ( p <0.05 ); hence, there was no statistically significant relationship between the group formation method and the learning experience outcome. Therefore, the study found that the learning experience outcome was similar for all learners regardless of the group formation method.
On the effectiveness of the group leader, the mean values ranged from 2.88 to 3.52; students positively recognized the roles played by the peer group leaders with the highest being enjoying working together and the lowest role was summarization of group’s discussion. Groups formed using GPA (class one) had their group leaders assigned using GPA, where the student with the highest GPA value in the group being assigned the role. Intelligent grouping method group (class two) had their leaders assigned from cluster one which had the most collaborative group as per the collaboration competence level. In random group formation group (class three), the group leader assignment was done through random assignment. Regardless of the group formation and group leader assignment method, group leaders agreed that they enjoyed playing the leadership role and this motivated them to read widely. Group members also enjoyed the role played by their leaders but they acknowledge that most of the group leaders were unable to summarize the group’s discussion. This was an indication that some roles, like summarization and making conclusion in a discussion, are more difficult to be realized through a group leader. Furthermore, there was a statistically significant relationship between the group leader summarization role and the group formation method (class type) where the p value =.020 (Significance of difference between class one, class two and class three: p <0.05).
On group task satisfaction, all the items were positively rated in all the three classes. Members enjoyed working in groups and more specifically on peer learning where they are able to criticize one another and reach a consensus. Group size which was four students per group was felt to be effective and most students recommended more group work in future studies with the same group membership, with a few citing a need for a change in group membership to get new experiences and exposure from new members. These group task outcome experiences were felt almost similarly in all classes regardless of the group formation technique. Therefore, the study did not find any statistically significant association as observed from Table 10 where none of the p values was less than.05 ( p <.05). These outcomes coincide with other studies which found that when group work learning is shifted from teacher control to student peer groups, it helps learners to acknowledge their dissent, disagreements and share their doubts(Bruffee, 1999). In addittion, students become co-constructors of knowledge rather than consumers.
What are the students’ perceived benefits of online collaborative learning?
From the cited examples on benefits which were reported by the participants (see Table 11), students’ responses confirmed that online collaborative learning has a number of benefits including: peer learning which provides a platform to freely criticize others work and offer alternatives making the learning process enjoyable, a platform for social interaction and exchange of ideas, and it provides a better opportunity for understanding concepts which are difficult to learn individually. These cited benefits truly correspond to the advantages of constructivism theory of learning (Palloff & Pratt, 1999) and the observed benefits of online collaborative learning from other studies.
Results from this study provide empirical evidence on the capability of an intelligent grouping algorithm to group students in a desirable manner which provides learning opportunities among peers similar to those ones realized through random assignment and GPA instructor-based methods. In addition, this intelligent grouping method guarantees heterogeneity based on learners’ collaboration competence level unlike the random assignments method which only increases the likelihood of heterogeneity in the group. With the understanding that GPA group formation method involves the instructor and it may not be dynamic, instructors are more likely to adopt our intelligent grouping methods as the findings show that both have similar results. Overall, it appears the intelligent grouping algorithm provide an added advantage in supporting group formation due to its guarantee on heterogeneity, dynamism, and less instructor involvement.
The positive findings on the role of group work as a learning tool from the students’ perspective informs the instructors the importance of including collaborative work in instructional design. In addittion, the positive findings provide a learning experienace to students with poor individual leaning skills to improve their learning through group learning. This enhances the overall quality of e-learning as well as increases the learner’s confidence.
Further research should explore how online collaborative learning can be made more effective by examining the instructors’ role in supporting group work, perceptions of group work, and level of experience in conducting collaborative learning. This could also shed more light on how to improve the quality of online collaborative learning. Future studies could also consider examining the effectiveness of collaborative learning in enhancing students’ learning skills and improving the level of knowledge constructed in blended e-learning platforms.
The authors appreciatively thank the National Commission for Science and Technology in Kenya for the financial support provided to facilitate data collection and analysis. The authors would also like to thank all the students in Kenyatta University who willingly agreed to participate in this study and their instructors for facilitating the collection of data.
Aher, S. B., & Lobo, L. M. R. J. (2011). Data Mining in Educational System using WEKA. In Proceedings of the International Conference on Emerging Technology Trends (ICETT) (Vol. 3, pp. 20–25). New York, USA: Foundation of Computer Science.
Alfonseca, E., Carro, R. M., Martin, E., Ortigosa, A., & Paredes, P. (2006). The impact of learning styles on student grouping for collaborative learning: A case study. User Modeling and User-Adapted Interaction, 16 (3–4), 377–401.
Bacon, D. R., Stewart, K. A., & Anderson, E. S. (2001). Methods of assigning players to teams: A review and novel approach. Simulation & Gaming, 32 (1), 6–17.
Bloom, B. S. (1956). The Taxonomy of Educational Objectives: Classification of Educational Goals Handbook 1: The Cognitive Domain. New York, NY: McKay Press.
Bruffee, K. A. (1999). Collaborative learning: Higher education, interdependence, and the authority of knowledge (2nd ed.). Baltimore, MD: The John Hopkins University Press.
Capdeferro, N., & Romero, M. (2012). Are online learners frustrated with collaborative learning experiences? The International Review of Research in Open and Distributed Learning, 13 (2), 26–44.
Chapman, K. J., Meuter, M., Toy, D., & Wright, L. (2006). Can’t we pick our own groups? The influence of group selection method on group dynamics and outcomes. Journal of Management Education, 30 (4), 557–569.
Connerley, M. L., & Mael, F. A. (2001). The importance and invasiveness of student team selection criteria. Journal of Management Education, 25 (5), 471–494.
De Faria, E. S. J., Adan-Coello, J. M., & Yamanaka, K. (2006). Forming groups for collaborative learning in introductory computer programming courses based on students’ programming styles: An empirical study. In Proceedings of the IEEE 36 th Annual Frontiers in Education Conference (pp. 6–11). San Diago,CA: IEEE.
Deibel, K. (2005). Team formation methods for increasing interaction during in-class group work. In ACM SIGCSE Bulletin (Vol. 37, pp. 291–295). Caparica, Portugal: ACM New York, NY, USA.
Dimopoulos, I., Petropoulou, O., Boloudakis, M., & Retalis, S. (2013). Using learning analytics in Moodle for assessing students’ performance.” In Proceedings of the 3rd International Conference on Learning Analytics and Knowledge –(LAK '13) (pp. 195–199). Leuven, Belgium: ACM New York, NY, USA.
Fraenkel, J. R., Wallen, N. E., & Hyun, H. H. (2012). How to design and evaluate research in education. New York, N.Y: McGraw-Hill Higher Education.
Garrison, D. R. (1993). A cognitive constructivist view of distance education: An analysis of teaching-learning assumptions. Distance Education, 14(2), 199-211.
Grigoriadou, M., Papanikolaou, K. A., & Gouli, E. (2006). Investigating how to group students based on their learning styles. In Proceedings of the 6 th IEEE International conference and Advanced Learning Technologies (pp. 1139–1140). Kerkrade,Netherlands: IEEE Computer Society.
Harasim, L., Hiltz, S. R., Teles, L., & Turoff, M. (1995). Learning networks: A field guide to teaching and learning online. Cambridge, MA: MIT Press.
Koppenhaver, G. D., & Shrader, C. B. (2003). Structuring the classroom for performance: Cooperative learning with instructor assigned teams. Decision Sciences Journal of Innovative Education, 1 (1), 1–21.
Liu, S., Joy, M., & Griffiths, N. (2009). iGLS: Intelligent grouping for online collaborative learning. In Proceedings of the 9 th IEEE International Conference on Advanced Learning Technologies (pp. 364–368). Riga,Latria: IEEE Computer Society.
Liu, S., Joy, M., & Griffiths, N. (2010). Students’ perceptions of the factors leading to unsuccessful group collaboration. In Proceedings of the 10 th IEEE International Conference on Advanced Learning Technologies (pp. 364–368). Sousse, Tunisia: IEEE Computer Society.
Messeguer, R., Medina, E., Royo, D., Navarro, L., & Juarez, J. P. (2010). Group prediction in collaborative learning. In Proceedings of the 6 th International Conference on Intelligent Environments, (pp. 350–355).
Muehlenbrock, M. (2006). Learning group formation based on learner profile and context. International Journal on E-Learning, 5 (1), 19–24.
Muuro, E., Wagacha, P., & R. Oboko. (2014). Improving online collaborative learning using machine learning. In J. Keengwe & J. J. Agamba (Eds.), Models for improving and optimizing online and blended learning in higher education (pp. 204–219). Pennsylvania, PA: IGI Global.
Muuro, E., Wagacha, P., R.Oboko, & Kihoro, J. M. (2014). Students’ perceived challenges in an online collaborative learning environment: A case of higher learning institutions in Nairobi, Kenya. The International Review of Research in Open and Distributed Learning, 15.
Nunnally, J. C. (1978). Psychometric theory (2nd ed.). New York, NY: McGraw-Hill.
Palloff, R. M., & Pratt, K. (1999). Building learning communities in cyberspace: Effective strategies for the online classroom. San Francisco, CA: Jossey-Bass.
Roberts, T. S., & McInnerney, J. M. (2007). Seven problems of online group learning (and their solutions). Journal of Educational Technology and Society, 10 (4), 257–268.
Schellenberg, J. A. (1959). Group size as a factor in success of academic discussion groups. The Journal of Educational Sociology, 33 (2), 73–79.
Scott, J. (2001). Social network analysis : A handbook (2nd ed.). London, UK: Sage.
Strong, J. T., & Anderson, R. E. (1990). Free-riding in group projects: Control mechanisms and preliminary data. Journal of Marketing Education, 12 (2), 61–67.
Wessner, M., & Pfister, H. R. (2001). Group formation in computer-supported collaborative learning. In Proceedings of the International ACM SIGGROUP Conference on Supporting Group Work 2001 (pp. 24–31). Boulder, CO: ACM Press.
Zorko, V. (2009). Factors affecting the way students collaborate in a wiki for English language learning. Australasian Journal of Educational Technology, 25 (5), 645-665.
![]()

Evaluation of Intelligent Grouping Based on Learners’ Collaboration Competence Level in Online Collaborative Learning Environment by Maina Elizaphan Muuro, Robert Oboko, and Waiganjo Peter Wagacha is licensed under a Creative Commons Attribution 4.0 International License.